Bringing Clarity to Treasury AI: Introducing GSmart


AI is changing the game in finance, but most solutions aren’t built for the unique demands of treasury. Black-box models, generic platforms, and disconnected tools create more questions than answers.
That’s why GTreasury built GSmart, the only treasury-specific AI solution.
Watch a recording of our latest webinar, “Bringing Clarity to Treasury AI: Introducing GSmart,” to see how purpose-built AI can deliver real-time insights, intelligent automation, and explainable results.
Transcript
00:00:14.130 --> 00:00:24.260
GTreasury Marketing: Hello, everyone, and thank you for joining us today. We will be starting in a couple minutes to give all of our attendees time to join the webinar. So sit tight and we will be starting shortly.
00:01:27.300 --> 00:01:37.979
GTreasury Marketing: Okay, Hello, everyone. Thank you for joining us today for our webinar, bringing clarity to AI introducing G. Smart. Let's cover a couple of housekeeping items before we get started.
00:01:39.800 --> 00:01:59.430
GTreasury Marketing: Today's event is scheduled to last an hour, including time for questions at the end all participants are muted, and if you have any questions at any time throughout the presentation, please enter them into the Q&A section on your Zoom control bar. This webinar is being recorded, and a link to the recording will be sent via email to all participants.
00:02:01.710 --> 00:02:08.490
GTreasury Marketing: Our speakers today are Evan Ryan and Mark Johnson. Therefore I will hand it over to them for a quick introduction.
00:02:09.710 --> 00:02:31.199
Evan Ryan: Thanks very much. Great to be here with you folks today. My name is Evan Ryan. I'm a product manager here at Treasury, specifying in cash forecasting. I'll be jumping into the demo at the end of the presentation today, and really excited to show you what we've been working on over the last number of weeks
00:02:31.320 --> 00:02:32.459
Evan Ryan: over to you, Mark.
00:02:33.210 --> 00:02:55.960
Mark Johnson: Awesome. Thanks, Evan. So again, welcome everyone. I'm Mark Johnson, chief product officer at G. Treasury. I lead our global product management design and quant teams. I spent most of my career at this intersection of finance and technology from payments and resource management to financial automation and payroll
00:02:56.090 --> 00:03:06.140
Mark Johnson: really excited to to be with you guys today and talk about how we can help treasury teams like yourself escape some of the manual work that we know we all have to deal with.
00:03:06.820 --> 00:03:11.649
Mark Johnson: So with that, we're gonna jump in to a little bit of our journey.
00:03:12.020 --> 00:03:22.200
Mark Johnson: As we think about the the time we have today, we're gonna focus a lot on education, but also taking that education and turning it into action.
00:03:22.410 --> 00:03:36.660
Mark Johnson: you will see what's happening in the market when it comes to AI for finance. We'll share some statistics we'll talk about where companies are moving and why this transformation can't wait.
00:03:37.170 --> 00:03:57.870
Mark Johnson: We'll talk about G. Smart. G. Smart is our AI philosophy that we really think about amplifying you and your teams rather than augmenting or taking away something very tactical. It's a lot more than that when it comes to the strategy we hope to free up for for your teams.
00:03:58.350 --> 00:04:14.209
Mark Johnson: we're gonna jump into where we're going from a product innovation perspective, as we think about reimagining treasury workflows to Evan's point. We're gonna showcase this coming together in the form of a real live in production demo
00:04:14.340 --> 00:04:20.519
Mark Johnson: and then kind of give you behind the scenes. Look into what we have been focused on recently.
00:04:21.130 --> 00:04:22.230
Mark Johnson: Q. And a.
00:04:22.400 --> 00:04:35.679
Mark Johnson: as we mentioned at the top, very important to us. So please jump in and use the Q&A function at any point as questions pop up. If we can't get to all the questions today, we will follow up individually
00:04:36.508 --> 00:04:53.720
Mark Johnson: so please make sure to use that function. The last thing I'll I'll lead with is we want today to be designed with one goal which is helping you free up time to do what you do best, think strategically, build relationships, and ultimately move your business forward.
00:04:55.780 --> 00:05:16.360
Mark Johnson: The moment for finance in regards to AI is truly now, as we think about the immense change that is happening, not a gradual change, but truly a seismic shift, and the power of generative AI in particular, for a lot of different functions.
00:05:16.680 --> 00:05:28.719
Mark Johnson: These are some stats that we've been following. These stats are constantly coming up in new sources wanted to to start off with a few that that we've been close to
00:05:29.320 --> 00:05:37.590
Mark Johnson: the 1st 79% of CFOs plan to increase AI budgets in 2025.
00:05:38.010 --> 00:05:51.469
Mark Johnson: The most revealing, revealing part of this stat is the fact that this isn't necessarily the early adopters or the tech enthusiasts. These are pragmatic finance leaders
00:05:51.840 --> 00:05:53.319
Mark Johnson: who have run the numbers
00:05:53.610 --> 00:06:13.949
Mark Johnson: they're not investing because AI is trendy. They're not investing because everyone's talking about AI. They're investing because they are seeing the real benefit, and they are also in that conversation with their peers, hearing the opportunity, when it comes, to taking away toil from their teams day to day.
00:06:14.050 --> 00:06:25.829
Mark Johnson: When you see 7, 8 out of 10 CFOs moving in the same direction, you can't assume it's a trend anymore. This is kind of the new way of being the new way of working
00:06:26.580 --> 00:06:28.240
Mark Johnson: the next big step.
00:06:28.660 --> 00:06:35.940
Mark Johnson: 94% of CFOs expect generative AI to strongly benefit their function.
00:06:36.340 --> 00:06:42.820
Mark Johnson: In my years of technology it is very rare to see such an overwhelming statistic.
00:06:43.050 --> 00:06:52.759
Mark Johnson: especially an agreement on a strategic initiative. We've all been in those discussions, those boardrooms, those executive meetings. When you have that large of a consensus.
00:06:52.890 --> 00:06:55.509
Mark Johnson: you know the evidence is undeniable at that point.
00:06:56.180 --> 00:07:06.460
Mark Johnson: When we think about the results. Just take forecasting as a simple example, being able to drive up accuracy 30% or more. That's a game changer.
00:07:07.230 --> 00:07:08.849
Mark Johnson: The 3rd big Stat.
00:07:09.340 --> 00:07:23.529
Mark Johnson: 58% of finance functions have already adopted. AI in 2024. Now, that doesn't necessarily mean that's all generative. AI traditional AI has been around a little bit longer when we think about machine learning.
00:07:23.660 --> 00:07:31.459
Mark Johnson: But what you should think about is the fact that this is climbed up from the 37% just a year prior.
00:07:31.670 --> 00:07:38.710
Mark Johnson: That's a big shift, and that also speaks back to AI becoming richer and richer, and its capabilities.
00:07:39.480 --> 00:07:43.240
Mark Johnson: The other piece, the other key piece, is, look at the right hand of the side
00:07:43.590 --> 00:07:46.560
Mark Johnson: when we think about where
00:07:46.850 --> 00:07:59.060
Mark Johnson: it gets really interesting. CFOs want AI that they can rely on. They don't want black boxes. They want transparency. They want an explanation.
00:07:59.340 --> 00:08:04.539
Mark Johnson: we know trust is earned. This is where G. Treasury lives by this motto every day.
00:08:05.050 --> 00:08:16.380
Mark Johnson: This also aligns with some recent research by McKinsey publishing their own state of AI report. And the fascinating part of that report is the fact that
00:08:16.670 --> 00:08:31.339
Mark Johnson: we're now at a point where 21% of of companies reported using generative AI and a completely reimagined workflow, a completely reimagined way of how work gets done in some function.
00:08:31.810 --> 00:08:36.569
Mark Johnson: The the other piece that was really interesting as we're going through this study is the fact that
00:08:37.159 --> 00:08:54.219
Mark Johnson: when you think about AI transformation, it's fundamentally an organizational transformation, that organization is rethinking the way work gets done, but also the tools that are leveraged to to create that work and complete that job to be done.
00:08:55.110 --> 00:09:06.709
Mark Johnson: The CEO, in particular, is the one that is frequently involved in overseeing that AI governance, big change from anything we have ever seen before in the world of technology.
00:09:10.020 --> 00:09:10.970
Mark Johnson: So
00:09:11.140 --> 00:09:21.190
Mark Johnson: what we wanted to jump into before we get too deep is a quick poll question on where you guys are in your journey.
00:09:21.560 --> 00:09:24.110
Mark Johnson: So the question is.
00:09:24.280 --> 00:09:34.230
Mark Johnson: when do you expect to implement AI in Treasury operations? We'll give everyone a few seconds to respond to that, and then look at the results.
00:10:24.370 --> 00:10:36.590
Mark Johnson: Okay, so looks like we've got 35% looking to implement AI in 2026, we've got
00:10:36.770 --> 00:10:49.559
Mark Johnson: another 11% that are already using AI today, and then 16%. That plan to introduce AI into their operations before the end of the year. So again.
00:10:50.090 --> 00:10:59.850
Mark Johnson: pretty relevant and related back to the slide before around 50 to 60% have already adopted, or plan to adopt in the near future.
00:11:04.320 --> 00:11:17.789
Mark Johnson: Now, some of you may have seen our introduction of G. Smart and G. Smart for for us is both a milestone, and it's a starting point on on this journey that we're now a part of.
00:11:18.030 --> 00:11:28.179
Mark Johnson: We introduced G. Smart as kind of the future of AI powered treasury. At the same time, we're not changing our our mission statement as a company.
00:11:28.300 --> 00:11:35.819
Mark Johnson: For years she, treasury has been focused on the clarity to act and to try and to drive value
00:11:36.220 --> 00:11:37.909
Mark Johnson: for our customers.
00:11:38.200 --> 00:11:42.229
Mark Johnson: What's changed is the magnitude of what's possible.
00:11:42.790 --> 00:11:48.860
Mark Johnson: G. Smart represents a belief that the future office of the CFO.
00:11:49.050 --> 00:11:53.570
Mark Johnson: Won't be defined just by the tasks that get completed, but
00:11:54.070 --> 00:12:03.720
Mark Johnson: the insights that can get surfaced, the insights that will showcase a little bit later today, but also the decisions that you can start to accelerate
00:12:03.940 --> 00:12:10.999
Mark Johnson: and the strategies that you can then enable, based off of that that decision. Making process
00:12:11.160 --> 00:12:17.809
Mark Johnson: happens when your people are freed from some of that operational toil that they experience today.
00:12:21.680 --> 00:12:31.099
Mark Johnson: AI isn't new to to G. Treasury. As I mentioned earlier, traditional AI has been around a number of years, and
00:12:31.821 --> 00:12:39.810
Mark Johnson: this table showcases a few things that that I wanted to express number one transparency.
00:12:40.170 --> 00:12:50.610
Mark Johnson: as we think about different solutions within G treasury. We want to tell you exactly what function the AI is performing.
00:12:51.190 --> 00:12:56.259
Mark Johnson: what type of model we are using specific to AI,
00:12:56.380 --> 00:13:00.520
Mark Johnson: and then also what are the benefits it brings to you
00:13:00.780 --> 00:13:06.830
Mark Johnson: when we talk about cash forecasting as an example using agentic AI
00:13:07.260 --> 00:13:12.489
Mark Johnson: for decision making. We want you to know what that means. And and how does that work?
00:13:13.020 --> 00:13:15.160
Mark Johnson: The second big thing is
00:13:15.330 --> 00:13:24.290
Mark Johnson: our approach, and how diverse it is when it comes to not forcing one AI model on every problem.
00:13:24.770 --> 00:13:36.310
Mark Johnson: We know that statistical modeling is great for predictions. We know that fuzzy logic can be great for pattern matching.
00:13:36.870 --> 00:13:44.690
Mark Johnson: We also know that agentic AI is great for intelligent decision, support, and actions.
00:13:44.810 --> 00:14:03.000
Mark Johnson: So as we think about the solutions within G treasury. We're very diligent on the application of the AI model best suited to complete some type of job that that unravels, that that takes away that toil and completes that job on your behalf.
00:14:03.950 --> 00:14:08.810
Mark Johnson: The last thing that we're constantly focused on is
00:14:08.960 --> 00:14:22.719
Mark Johnson: the results we obviously are investing time to go and build this solution. And we want to make sure we are investing that time effectively. And as we think about the benefits that are possible.
00:14:22.780 --> 00:14:45.009
Mark Johnson: these aren't just theoretical anymore. Well, these are benefits. We're seeing firsthand when it comes to forecast accuracy, improving when it comes to risk scenarios being simulated in minutes and not hours. When it comes to integrations they used to take. Weeks can now be done in hours.
00:14:45.160 --> 00:14:49.190
Mark Johnson: All of this is real, tangible benefit that that drives value.
00:14:49.470 --> 00:14:57.270
Mark Johnson: This foundation also matters because it's the culmination of everything we've learned over time
00:14:57.540 --> 00:15:05.509
Mark Johnson: and how we've embedded intelligence within treasury workflows at the same time being very centered around.
00:15:05.610 --> 00:15:07.910
Mark Johnson: What does your team actually need?
00:15:11.620 --> 00:15:13.199
Mark Johnson: Probably the elephant in the room
00:15:13.610 --> 00:15:28.680
Mark Johnson: data. And obviously this is near and dear to our heart. It's near and dear to your heart. But protecting that data is, 1st and foremost, that the biggest principle we have, as we think about G. Smart.
00:15:29.100 --> 00:15:32.360
Mark Johnson: we started with Hey, earning your trust
00:15:32.510 --> 00:15:39.040
Mark Johnson: requires more than just promises. It requires a well sound architecture approach.
00:15:39.250 --> 00:15:47.569
Mark Johnson: It requires governance, it requires transparency, and what's taking place across the platform.
00:15:47.730 --> 00:15:51.980
Mark Johnson: And as we think about starting with the the data side.
00:15:52.090 --> 00:16:17.150
Mark Johnson: we want to make sure that, hey, you trust how we have created the solution. It all starts with your data. Living in your own environment. There's no co-processing. There's no sharing of data across tenants. There's no mysterious data lake where information could be co-mingled. Think of it as you have your own private AI that's been trained on
00:16:17.450 --> 00:16:21.390
Mark Johnson: the world's knowledge, but then can only see your data.
00:16:21.960 --> 00:16:32.249
Mark Johnson: The second big thing that has been a principle we followed is the fact that this is inference only. AI. What does that mean? It means that your data
00:16:32.410 --> 00:16:34.719
Mark Johnson: is never used to train models.
00:16:35.350 --> 00:16:41.420
Mark Johnson: We make sure the AI applies its intelligence to your data without learning from it.
00:16:42.510 --> 00:16:47.239
Mark Johnson: Another key piece is geographic control.
00:16:47.510 --> 00:16:52.089
Mark Johnson: We serve customers all over the globe. We want your data
00:16:52.260 --> 00:16:57.590
Mark Johnson: at rest to stay at rest within your selected geographic region.
00:16:57.760 --> 00:17:02.910
Mark Johnson: Whether that's in the Us. Whether that's in EMEA. Whether that's in APAC
00:17:03.110 --> 00:17:09.520
Mark Johnson: that goes back to how we set up just from the start, finally, control
00:17:10.351 --> 00:17:38.769
Mark Johnson: visibility into what is taking place in the platform is is key as well as the outputs that are being delivered. So being able to showcase the dotted trails around those outputs to showcase why a a particular step was taken. And then the user involvement around working with that particular let's call it agent. Experience like that could exist within the platform
00:17:39.800 --> 00:17:47.799
Mark Johnson: much more we go into here, but definitely wanted to focus on hey? Top of mind for us always as we're building
00:17:49.720 --> 00:18:00.650
Mark Johnson: the other piece that we wanted to walk through and kind of sneak peek behind the hood is our own internal transformation at G. Treasury.
00:18:01.350 --> 00:18:19.169
Mark Johnson: You've probably heard me mention transformation. You've heard me mention journey, and that's because it it really is. We're all keeping abreast with what's going on in the market. What are new sources we want to tap into to learn. How do we continue to set up our teams for success? And as we think about
00:18:19.420 --> 00:18:25.750
Mark Johnson: this particular slide, these aren't just principles, but they're how we operate day to day
00:18:25.960 --> 00:18:31.069
Mark Johnson: and to kind of give you some some real tangible examples here.
00:18:31.260 --> 00:18:46.710
Mark Johnson: Our product team, Evan, myself, the rest of the team. We're using AI across different parts of our day to day workflow when it comes to how we think about writing product requirements for something new that we plan to develop
00:18:47.000 --> 00:19:07.470
Mark Johnson: how we are able to prototype designs again in minutes which would have taken weeks before. That allows us to get real time feedback from those of you who are on the call from our clients, our our prospects, our partners, that feedback allows us to move a lot faster, and then
00:19:07.780 --> 00:19:12.390
Mark Johnson: we can frankly use that time back to spend more time.
00:19:12.570 --> 00:19:21.820
Mark Johnson: better understanding where you have new problems that are there popping up. It's that shift from doing manual work to more strategic work.
00:19:22.560 --> 00:19:30.000
Mark Johnson: The other piece that has been a big amplifier for us is this, this culture of experimentation.
00:19:30.210 --> 00:19:50.189
Mark Johnson: and where we see a lot of value and benefit is the ability to run workshops, the ability to run hackathons, to have a thesis in mind so that we're not chasing every shiny object. You will hear a lot of companies building AI just to build AI.
00:19:50.620 --> 00:19:59.339
Mark Johnson: We don't want to be that company. We want to make sure that we are scaling something that actually works and actually solves a problem
00:20:00.250 --> 00:20:03.229
Mark Johnson: outcome which leads us to outcome driven innovation.
00:20:03.840 --> 00:20:22.950
Mark Johnson: We've developed our own framework on how we think about prioritizing use cases. And to give you an example there for us, is it a high frequency task that's being done by a number of of companies? Is it a high, painful task? And then
00:20:23.070 --> 00:20:35.210
Mark Johnson: can AI actually amplify that that experience, that process? So someone spending a day a week on forecast analysis could hit all 3 check check boxes.
00:20:36.200 --> 00:20:47.570
Mark Johnson: the last and definitely most important. Hey, we want to bring our customers along as a part of any of this experience, and we want to start with conversations. We want to start with
00:20:47.710 --> 00:20:51.679
Mark Johnson: an early access program. That is, that isn't just beta testing.
00:20:51.790 --> 00:21:04.560
Mark Johnson: But it's frankly co-creating the experience together. When a customer tells us, Hey, I need a board level view of these insights. They're not just giving feedback. They're helping us co-design as we go.
00:21:04.840 --> 00:21:05.680
Mark Johnson: So
00:21:05.870 --> 00:21:13.729
Mark Johnson: take these principles, adapt them, modify them as as best fit for for you and your company. And then.
00:21:14.311 --> 00:21:22.619
Mark Johnson: understand, it isn't all technology. It's also about, hey? Starting with conviction, starting with your team and and your culture as a company.
00:21:25.930 --> 00:21:33.159
Mark Johnson: So now we're gonna switch gears a little bit and we're gonna showcase what we've been working on.
00:21:33.500 --> 00:21:51.989
Mark Johnson: some of which is live, some of which is in flight and definitely has an opportunity to get early access candidates, giving us feedback along the way. And some of it's in that design stage, but wanted to showcase a few examples to make it real for for you guys
00:21:53.070 --> 00:22:02.229
Mark Johnson: to to level set here, as we think about G. Smart, there's 2 key components to keep in mind
00:22:03.040 --> 00:22:04.100
Mark Johnson: one.
00:22:04.300 --> 00:22:13.169
Mark Johnson: It is how we're thinking about agents, agents that are designed to complete a specific Treasury task
00:22:13.320 --> 00:22:24.959
Mark Johnson: agents that can reason through problems. They can discover patterns, and they can recommend an action all while keeping the team in the loop
00:22:25.320 --> 00:22:27.039
Mark Johnson: throughout that process.
00:22:27.540 --> 00:22:29.810
Mark Johnson: The second piece is.
00:22:30.090 --> 00:22:50.090
Mark Johnson: think of it as your control tower, your hub where it's not just a dashboard of what's taking place, but a single area of the platform where you can govern, you can create, you can set your own unique thresholds to any one experience.
00:22:50.520 --> 00:23:00.329
Mark Johnson: We obviously know that not all clients are treated equally. Everyone has their own policies, their own processes. This is where the hub starts to come into play
00:23:00.680 --> 00:23:13.069
Mark Johnson: without the Hub. Agents are just isolated tools, and could be powerful, but could be very disconnected from your processes. So you don't want that. At the same time.
00:23:13.200 --> 00:23:14.759
Mark Johnson: if you think about
00:23:14.870 --> 00:23:32.569
Mark Johnson: only having a hub, you don't want just the dashboard and no ability to go orchestrate your own workflows. So the 2 elements come together as we think about our G. Smart AI vision, and then become a key compart of any treasury transformation.
00:23:35.710 --> 00:23:45.559
Mark Johnson: G. Smart forecast insights. I will purposely not steal too much of Evan's thunder here, as we will go deep in a demo. But
00:23:45.820 --> 00:23:59.860
Mark Johnson: did wanna showcase a little bit by telling a story on kind of how this started for us. So fictitious name. We'll use Sarah as a Treasury leader, who represents probably a lot of you on the call.
00:24:00.680 --> 00:24:04.110
Mark Johnson: Every, let's say Thursday of every week
00:24:04.270 --> 00:24:21.420
Mark Johnson: she goes through a routine. She's creating her own forecast comparison report. She probably has to export that to excel, to do her own analysis. She's typically going line by line to identify what's the largest variance?
00:24:21.770 --> 00:24:26.139
Mark Johnson: Where should I be concerned? What's unexplained versus explained.
00:24:26.310 --> 00:24:37.650
Mark Johnson: And then she's gotta put that all into some type of executive summary that executive summary could be for her executive team could be for a manager. It could be used in a board presentation.
00:24:38.340 --> 00:24:48.230
Mark Johnson: all that being said, that is a manual process that takes a number of hours every week for Sarah, and then the recipients of that information.
00:24:49.680 --> 00:24:56.319
Mark Johnson: When you think about G. Smart forecasting sites, our goal is, how do we reduce
00:24:56.480 --> 00:25:00.099
Mark Johnson: that Marathon into a 15 min sprint?
00:25:00.280 --> 00:25:03.620
Mark Johnson: And that's what Evan's gonna showcase in a little bit.
00:25:05.460 --> 00:25:16.530
Mark Johnson: The second item that we wanted to highlight is a similar approach to our risk management solution. But
00:25:16.970 --> 00:25:21.140
Mark Johnson: different use case when we think about risk
00:25:21.750 --> 00:25:34.460
Mark Johnson: risk. Policies in particular are those very lengthy, probably multiple format documents that have very good content, but trapped in a static way.
00:25:35.200 --> 00:25:40.940
Mark Johnson: you may have exposures that are tracked and excel spreadsheets.
00:25:41.200 --> 00:25:50.269
Mark Johnson: You may have your policy set up to identify when you have a breach, but maybe you don't find out about that breach until months later.
00:25:51.580 --> 00:25:55.650
Mark Johnson: Generally, you're you're falling way too late of a process. So
00:25:56.070 --> 00:25:59.330
Mark Johnson: as we think about applying AI here.
00:25:59.750 --> 00:26:02.950
Mark Johnson: G. Smart risks, insights can go back to
00:26:03.300 --> 00:26:24.769
Mark Johnson: saving you time and helping you in that decision making. We can look at using AI to read risk policies to monitor your exposures continuously to alert you before breaches occur, all that in real time within the platform. Not after this occurs, but before it occurs.
00:26:24.970 --> 00:26:32.279
Mark Johnson: And again, this is one of those areas that we're starting to work on now, and obviously would love feedback
00:26:32.540 --> 00:26:36.780
Mark Johnson: from from those on the call. As we as we go down this journey. Next.
00:26:37.240 --> 00:26:43.990
Mark Johnson: the 3rd piece that we wanted to showcase is called our G smart Hub.
00:26:44.750 --> 00:26:57.190
Mark Johnson: and, as I mentioned a little bit earlier again, think of this as kind of your control tower, your command center, that you can have visibility into what agents are available.
00:26:57.590 --> 00:27:12.189
Mark Johnson: you can start to determine which ones make sense for your business, and then you can take that next step of how do I want to configure it to my business? So, to give you a real life example. Think about
00:27:12.440 --> 00:27:15.760
Mark Johnson: the cash forecast submission process.
00:27:15.890 --> 00:27:23.340
Mark Johnson: You have multiple business units across the globe. Multiple people involved in submitting forecasts
00:27:23.490 --> 00:27:36.690
Mark Johnson: over a high frequency basis. What if you're the person who's chasing them all down? Well, that's that's not fun sending emails. They get phone calls trying to get everyone to go through the process. You've said.
00:27:37.320 --> 00:27:48.109
Mark Johnson: What if you could have an agent that that takes that action on your behalf? What if you could configure it to the point that says, Hey, look! Forecast submissions are going to be due
00:27:48.250 --> 00:27:51.100
Mark Johnson: every Friday at this point of every week.
00:27:51.320 --> 00:27:58.429
Mark Johnson: and I'm going to get a real time. Snapshot of who's submitted versus who hasn't submitted by middle of the week.
00:27:58.590 --> 00:28:00.250
Mark Johnson: and if you haven't submitted.
00:28:00.590 --> 00:28:14.970
Mark Johnson: have the agent chase you down and and remind you that we need the forecast submitted by the State, and then you can continuously get a snapshot of progression, of completed forecasts, thus driving
00:28:15.250 --> 00:28:42.540
Mark Johnson: a much more proactive behavior and giving you time back in your day to day. That's just one example of where you can start to control that experience to your own internal process. And then the second piece of it is okay. I can start to view other usage statistics across other agents. I can start to see the Roi firsthand
00:28:42.630 --> 00:28:49.879
Mark Johnson: of time savings that may be realized. Efficiency gains forecast accuracy, gains
00:28:50.210 --> 00:29:05.420
Mark Johnson: all of that in one place, and you can then follow what you want to do next. And maybe if I'm having success with this agent, I can go and think about this, this next use case and start to measure the Roi there
00:29:06.230 --> 00:29:17.139
Mark Johnson: again. This is this is where we're going, and and more to come on this one, and always for feedback as we as we co-design this with with an existing group of clients.
00:29:19.110 --> 00:29:28.719
Mark Johnson: So we're gonna switch gears again. And we're gonna open up another poll question. And as a part of this poll question
00:29:29.130 --> 00:29:32.960
Mark Johnson: I'll I'll have Evan. Then jump into the demo
00:29:33.931 --> 00:29:37.550
Mark Johnson: after the demo. We will leave some time for Q&A at the end.
00:29:45.230 --> 00:29:53.710
Mark Johnson: The question is, in which areas would your organization like to raise the bar for forecasting? And you can check multiple answers.
00:31:00.480 --> 00:31:04.439
Evan Ryan: I think we might give it one more, one or 2 more seconds on the
00:31:04.610 --> 00:31:09.270
Evan Ryan: those answers should be popping up perfect.
00:31:10.210 --> 00:31:13.250
Evan Ryan: Okay, so in which areas
00:31:14.316 --> 00:31:17.679
Evan Ryan: would your organization like to raise the bar for forecasting
00:31:18.739 --> 00:31:28.300
Evan Ryan: more advanced methods can see coming in at 24% better explanations required, and
00:31:28.500 --> 00:31:31.899
Evan Ryan: you can see less tolerance for errors at 11%.
00:31:33.120 --> 00:31:39.439
Evan Ryan: But just to call out the the better explanations required coming in at 27%. The highest
00:31:40.146 --> 00:31:42.280
Evan Ryan: are the more advanced methods
00:31:42.410 --> 00:31:58.379
Evan Ryan: at 24%. You know, that really does feed into the demo that I'll actually be jumping into now really focusing on the you know better explanations required so highlighting those key insights in a
00:31:59.210 --> 00:32:00.860
Evan Ryan: AI agentic manner
00:32:01.020 --> 00:32:16.189
Evan Ryan: and more advanced methods, there's some really cool data visualizations that I'm really excited to to show you today. So with that, I'll start sharing my screen here, Mark and I'll jump into the demo
00:32:22.690 --> 00:32:23.710
Evan Ryan: perfect.
00:32:24.746 --> 00:32:30.449
Evan Ryan: So here within GtTreasury, forecasting within our reporting suite.
00:32:31.327 --> 00:32:38.569
Evan Ryan: So, as Mark mentioned, you know, we're deploying AI across the G Treasury platform
00:32:39.353 --> 00:32:46.819
Evan Ryan: initially within G. Treasury forecasting and specifically within the G Treasury forecasting suite itself.
00:32:47.240 --> 00:32:52.459
Evan Ryan: So what we're looking at here is the landing page for the comparison report
00:32:53.190 --> 00:33:02.239
Evan Ryan: the comparison report compares 2 separate versions or snapshots of your forecast.
00:33:02.490 --> 00:33:10.630
Evan Ryan: In this instance I have my latest submission. So again, as Mark was talking about the G smart Hub.
00:33:11.334 --> 00:33:21.839
Evan Ryan: and that Treasury analyst preparing their submissions. Let's say that submission is prepared and finalized on that Thursday, and then that user then wants to compare
00:33:22.000 --> 00:33:31.179
Evan Ryan: the version that they've just prepared. Compare that, then, to their previous version, and then to dig into the variances in that report.
00:33:31.340 --> 00:33:33.910
Evan Ryan: So actually just run the report here.
00:33:35.800 --> 00:33:41.400
Evan Ryan: I have my report here with my forecast versus actuals and my forecast versus forecast.
00:33:41.680 --> 00:33:45.019
Evan Ryan: and I've grouped it by business unit.
00:33:45.490 --> 00:34:03.829
Evan Ryan: One thing I want to call out is that initial new feature that we have here? So you can see a spotlight panel that I can expand upon, and that's straight away, highlighting key variances that are surfaced within that report. So you know.
00:34:04.070 --> 00:34:12.650
Evan Ryan: we're talking about really reducing that toil and straight away you can see that this is really delivering value.
00:34:12.800 --> 00:34:16.739
Evan Ryan: So in this case there are 4 hidden cash flow differences that are uncovered.
00:34:17.179 --> 00:34:21.800
Evan Ryan: Firstly, we have a closing balance variance of a little over
00:34:22.110 --> 00:34:30.370
Evan Ryan: half 1 million dollars, calling out that balance between that forecast versus actuals piece than the largest negative variance.
00:34:30.510 --> 00:34:33.860
Evan Ryan: the largest positive variance, and then
00:34:34.020 --> 00:34:56.489
Evan Ryan: 2 new metrics that we're introducing as well. So smape and wmape really focusing on the accuracy of your forecast. So wmape is the weighted version really focusing on looking at the big ticket items and smape, looking at each line item in this case at an individual weighted level.
00:34:56.820 --> 00:35:16.689
Evan Ryan: and to interpret this. So the lower both of these figures are the better. But just to interpret what I'm looking at here, it looks like, because this W. Map is lower. I'm better at forecasting the bigger ticket items, and than I am at forecasting the smaller ticket items.
00:35:17.390 --> 00:35:38.680
Evan Ryan: I can click on this. I can see a bit more of an explainer here. And also we've embedded a helpful guide that goes into a bit more from a mathematical standpoint with the different formulas that we're using and how to actually interpret it, the pros and cons of the 2 different metrics.
00:35:38.920 --> 00:35:45.009
Evan Ryan: and, as I said, how to interpret your metrics, and then tips on how to improve your forecast
00:35:45.200 --> 00:35:46.439
Evan Ryan: going forward.
00:35:46.990 --> 00:35:50.350
Evan Ryan: So with that I'll generate the insights.
00:35:50.540 --> 00:35:53.590
Evan Ryan: And so, as I said, you know.
00:35:53.790 --> 00:35:59.869
Evan Ryan: straight away, I'm seeing great value from G smart, but I can, you know.
00:36:00.400 --> 00:36:05.645
Evan Ryan: do a deeper dive of my variance report here, and
00:36:06.910 --> 00:36:14.979
Evan Ryan: I can see from my tooltip here. So it's doing a number of things and evaluating the variance
00:36:15.560 --> 00:36:29.589
Evan Ryan: materiality thresholds. So it's preparing that forecast assessment, that executive summary that Mark was talking about a couple of moments ago, and then really will lead into the different sections of the report.
00:36:30.180 --> 00:36:33.060
Evan Ryan: And then, you know, based off of that
00:36:33.520 --> 00:36:47.470
Evan Ryan: question that was posed to you a couple of months ago. The on that poll question, a couple of cool visualizations that I I want to show you today.
00:36:48.410 --> 00:36:52.889
Evan Ryan: So and it's not just in the comparison report. This
00:36:53.060 --> 00:36:59.099
Evan Ryan: insights is actually also available in the Consolidation Report, which I'll show you in a couple of moments.
00:37:00.580 --> 00:37:09.970
Evan Ryan: So straight off the bat I can see what 2 submissions are being compared, and then the deep dive
00:37:10.556 --> 00:37:24.639
Evan Ryan: in the actual analysis. So I can look here at servicing the executive summary. So a high, level overview of the actual report that I sent to the AI model to be analyzed.
00:37:24.880 --> 00:37:32.540
Evan Ryan: I'm calling out the opening balance, the receipts, and then there are a number of key areas that I want to call out.
00:37:32.710 --> 00:37:41.239
Evan Ryan: firstly, the receipts, variance analysis. So those favorable variances and then unfavorable variances.
00:37:41.360 --> 00:37:47.629
Evan Ryan: and then the same side on the payments side as well. So those payment variance analysis.
00:37:49.230 --> 00:37:55.959
Evan Ryan: There's a table here for my top, 5 variants, so I can see my intercompany line item
00:37:56.170 --> 00:38:04.010
Evan Ryan: in the Ireland business unit had a variance of 6.7 million dollars. In this specific period
00:38:05.010 --> 00:38:23.699
Evan Ryan: a really exciting new feature or new part of this feature is the areas to investigate and act. And so, as Mark mentioned, you know, this really does save a lot of time. So you can see within a couple of moments. I've already generated an executive level summary report.
00:38:24.343 --> 00:38:34.089
Evan Ryan: I can easily copy this out, paste it into a an email. Send that to my manager to send that to the Cfo.
00:38:34.660 --> 00:38:40.080
Evan Ryan: But also highlighted here is that areas to investigate and act, and
00:38:40.350 --> 00:38:52.387
Evan Ryan: to really turn around that forecast accuracy and that you're seeing here. So in this case, 15.3% and really surfing, surfacing those insights.
00:38:53.110 --> 00:39:04.589
Evan Ryan: and no longer having to, you know. Dig through this report and go through that toil. It's already surfaced here so that you can quickly improve your forecast accuracy.
00:39:05.250 --> 00:39:13.779
Evan Ryan: I can also interact with the report here and give it a thumbs up and a thumbs down, and so that this report would be
00:39:14.220 --> 00:39:19.140
Evan Ryan: provided to you. You know, improved the next time you use it.
00:39:19.530 --> 00:39:29.789
Evan Ryan: So, as I said here, you know already I'm seeing great value from the spotlight panel. Those key variances are surfaced straightaway.
00:39:30.000 --> 00:39:37.640
Evan Ryan: and then once I click that generate insights button, I can see an executive summary level report is created here.
00:39:39.170 --> 00:39:43.730
Evan Ryan: but I can actually do a deeper dive on that
00:39:43.850 --> 00:39:48.389
Evan Ryan: on that data, on my report. So I can see a number of questions here.
00:39:48.640 --> 00:39:55.360
Evan Ryan: We've built up a bank of questions. I'm working with a an Sme group.
00:39:55.510 --> 00:40:07.040
Evan Ryan: and essentially the Llm. The AI. Is suggesting, based off of the content of this report. What questions best suit
00:40:07.380 --> 00:40:08.519
Evan Ryan: this report?
00:40:08.720 --> 00:40:11.780
Evan Ryan: So in this case. I'm going to ask.
00:40:11.970 --> 00:40:18.870
Evan Ryan: And AI, so what are my top? 5 closing balance variances by business unit?
00:40:19.250 --> 00:40:42.909
Evan Ryan: And essentially what this will do is generate a graph with a narrative attached to that graph here. So again, I've done this previously as well in previous roles, and I'm sure a lot of people on this call have done this where you're generating these graphs within excel, and you're picking different columns. But you can see how quickly
00:40:43.020 --> 00:40:45.020
Evan Ryan: this graph was generated.
00:40:45.580 --> 00:40:55.869
Evan Ryan: Again, I can copy this out individually, but what I would actually like to do is, I would like to add this to my report, and I can generate a final report
00:40:56.010 --> 00:40:57.000
Evan Ryan: at the end.
00:40:57.770 --> 00:41:04.420
Evan Ryan: So I'm going to ask a couple of more questions here. So how is my forecast accuracy trending?
00:41:04.930 --> 00:41:05.880
Evan Ryan: And
00:41:06.040 --> 00:41:18.169
Evan Ryan: so at a specific business unit level. And again, I'm going to get a graph that I can, you know, is quickly generated with a narrative. I could add that to my report.
00:41:18.330 --> 00:41:25.210
Evan Ryan: and in this case I'm wondering, you know, which business units at least accurate.
00:41:26.910 --> 00:41:47.139
Evan Ryan: So again, you know something that would take you know, time to download this report in excel imported, pull out my specific tables, build this in, excel, you know, quickly generate it, and I can add this to my report. So now that I have my executive summary report up top.
00:41:47.480 --> 00:41:52.179
Evan Ryan: and I've run my 3 different questions. But as if
00:41:52.680 --> 00:41:59.320
Evan Ryan: you'll note there, I've tagged each of them to be generated or to be included in a final report.
00:42:00.010 --> 00:42:09.809
Evan Ryan: So, rather than just generating a report where those 3 visualizations are kind of tagged on to the
00:42:10.280 --> 00:42:26.060
Evan Ryan: top summary, a cohesive narrative is actually created. So again, the AI is sent that 1st executive summary and those 3 reports, and is essentially prompted.
00:42:26.170 --> 00:42:27.840
Evan Ryan: and to be told.
00:42:28.000 --> 00:42:50.220
Evan Ryan: create a cohesive summary, a cohesive narrative based off of the executive summary and your 3 additional insights. And really, you know again. This is a fantastic time saver for users rather than having to go in, and, you know, adjust and update the narrative in the executive summary, and also
00:42:50.790 --> 00:43:04.839
Evan Ryan: the AI is prompted to disperse those visualizations as it best sees fit, and to, you know, ensure that there is a complete narrative. On the whole report.
00:43:05.429 --> 00:43:09.379
Evan Ryan: You know, and again, you know, users can export this to
00:43:10.240 --> 00:43:20.130
Evan Ryan: so that they can easily send this on in a board deck for for reporting, so I can see my executive summary is still here.
00:43:20.694 --> 00:43:21.935
Evan Ryan: You know. But
00:43:22.520 --> 00:43:32.100
Evan Ryan: I can see it's now, you know, focusing on it now knows that there is a business unit with the lowest frequency chart. So if I was to view the initial summary
00:43:32.240 --> 00:43:34.089
Evan Ryan: that wouldn't actually be there.
00:43:34.621 --> 00:43:46.259
Evan Ryan: Because, okay, so it's input this top 5 business unit by closing balance variance here again, not just tagging it on at the bottom, but creating that cohesive narrative.
00:43:47.282 --> 00:43:49.889
Evan Ryan: I can see my receipts, variance analysis.
00:43:50.716 --> 00:43:55.190
Evan Ryan: my payments, variance analysis. And then that forecast accuracy as well.
00:43:55.790 --> 00:44:05.690
Evan Ryan: So that's the forecast insights from the comparison report. I'm going to jump into the Consolidation report here.
00:44:05.850 --> 00:44:20.939
Evan Ryan: and I'll run my report. And again that consolidation report really is that Consolidated Bird's eye view of all of the different business units that I have in my system, in one cohesive view from a forecasting perspective.
00:44:21.340 --> 00:44:24.160
Evan Ryan: So again, I'm greeted with my spotlight panel.
00:44:24.860 --> 00:44:29.910
Evan Ryan: In this instance I can see there are 3 hidden cash flow differences uncovered.
00:44:30.060 --> 00:44:43.319
Evan Ryan: 1, st one is calling out the business units that are holding the most cash. So what business units are cash rich in this instance? So I can see the Uk. Canada and Netherlands.
00:44:44.390 --> 00:44:49.589
Evan Ryan: and very importantly as well what business units are experiencing.
00:44:50.228 --> 00:44:52.019
Evan Ryan: You know, short liquidity.
00:44:52.250 --> 00:45:00.899
Evan Ryan: Okay? So in this case there are 10 business units that are experiencing short liquidity. And the 3rd piece, then, is an overview of how my forecast
00:45:01.840 --> 00:45:08.990
Evan Ryan: is a going to basically trend over the next number of weeks. In this case, 13 weeks.
00:45:09.100 --> 00:45:17.300
Evan Ryan: I'm calling at the highest expected range over that week, those number of weeks so similar to the
00:45:17.966 --> 00:45:21.540
Evan Ryan: Comparison report. I'm going to generate my insights.
00:45:23.070 --> 00:45:45.850
Evan Ryan: you know, and as a user. You can really see the benefit of G. Smart here, straight off the bat again in the Consolidated report with that spotlight panel. Traditionally, users would have to download this in. Excel, start to go through it. Surface. Those, let's say, 3 business units that are cash, rich cash poor.
00:45:46.220 --> 00:45:58.550
Evan Ryan: whereas you know you can see straight away. I'm surfacing that information and but also again, like the Comparison report going into a deep dive analysis of the Consolidation report here.
00:45:59.160 --> 00:46:06.309
Evan Ryan: you know, obviously focusing on it from a liquidity perspective. Okay? So I have my executive summary
00:46:06.460 --> 00:46:22.960
Evan Ryan: and my current liquidity position. So in this case I can see I have 23.4 days of cash. So what's my starting balance? And what's my daily cash outflow? So in this instance, okay, I know I have 23.4 days of cash.
00:46:23.673 --> 00:46:37.219
Evan Ryan: Calling up my cash forecast. How that's looking over this 13 week period, and then the liquidity risk. So what business units are at risk from liquidity, perspective?
00:46:37.420 --> 00:46:44.740
Evan Ryan: What period does that call to, and the actual liquidity position for each of those business units.
00:46:45.630 --> 00:47:01.760
Evan Ryan: and similar to the comparison report highlighting those areas to investigate and act. So again, no longer having to dig through excel once you've exported this report. That's highlighted straight away so you can take, you know. Action.
00:47:02.292 --> 00:47:04.110
Evan Ryan: You know, straight off the bat
281
00:47:04.690 --> 00:47:25.460
Evan Ryan: again. I can copy this out. I can give it feedback, give it. A thumbs up, thumbs down, and you know, as I said, with the comparison report, consolidation report straight away. I'm getting great insights that I can easily send to senior management for reporting. But also I'm presented with a
00:47:25.580 --> 00:47:31.480
Evan Ryan: in this case 3 questions from a bank of questions that we've built up, that again, the
00:47:31.620 --> 00:47:38.869
Evan Ryan: AI is suggesting best fits the actual data in your graph or in your report here.
00:47:39.160 --> 00:47:44.389
Evan Ryan: So in this case, I want to know. Let's say, what business units
00:47:44.530 --> 00:47:48.120
Evan Ryan: are projected to run risk running out of cash.
00:47:49.340 --> 00:48:03.879
Evan Ryan: So again, similar to the comparison report, I'm going to be presented here with a table and and a narrative to go along with that table as well. So again say I want to add this to my report.
00:48:05.095 --> 00:48:09.319
Evan Ryan: Which, and let's say which business units have the highest cash position.
00:48:09.870 --> 00:48:12.897
Evan Ryan: And so here I I'm kind of
00:48:13.450 --> 00:48:17.840
Evan Ryan: told at a high level. In this case 10 business units and
00:48:19.800 --> 00:48:29.520
Evan Ryan: at expected to fall below the liquidity. And here we're calling it those top 5. Okay? So in this case I can see the United Kingdom.
00:48:31.110 --> 00:48:41.470
Evan Ryan: has the sorry in here. Yes, the the largest cash position. Here. We can see that the United Kingdom has the highest cash position, so I can add this to my report.
00:48:42.093 --> 00:48:46.976
Evan Ryan: And say, you know what business units are contributing most to
00:48:47.630 --> 00:48:58.589
Evan Ryan: Monster Cache Burn, so similar to the previous visualizations. I'm again presented with a table here and a narrative to go along with it.
00:48:58.760 --> 00:49:04.880
Evan Ryan: so I can add this to my final report, and I'm going to now request a final report.
00:49:05.370 --> 00:49:10.130
Evan Ryan: So, as I said with the comparison report here
00:49:10.580 --> 00:49:18.839
Evan Ryan: the Consolidation report, is sent to the AI, and then that executive summary is generated. I've asked.
00:49:19.180 --> 00:49:27.809
Evan Ryan: 3 insightful questions. And those insights are raised here and again those graphs
00:49:27.990 --> 00:49:53.869
Evan Ryan: and the narrative associated with them. They're not just appended to that executive summary up top. They're incorporated into the overall flow of the actual executive summary. So you know, again, saving time rather than having to go in and adjust the actual. You know executive summary. It intersperses those insights where it best fits, so that there's a cohesive narrative.
00:49:54.790 --> 00:50:01.450
Evan Ryan: So I can see here my business units with highest cash cash position and calls out, then the cash
00:50:01.780 --> 00:50:04.960
Evan Ryan: forecast. My average cash flows.
00:50:05.860 --> 00:50:19.169
Evan Ryan: my average cash outflows per business unit. And then my liquidity risk as well. And again, if I was to, kind of, you know, take a look through the narrative here again. It's going to tweak that nerve so that there is that
00:50:19.470 --> 00:50:26.960
Evan Ryan: cohesive narrative from a reporting perspective. Again, I can copy this out, put it into a board pack
00:50:27.340 --> 00:50:32.600
Evan Ryan: prepared for a deck that I can, you know, saves me a lot of time and and toil.
00:50:33.590 --> 00:50:38.799
Evan Ryan: So with that I'll stop sharing. I'll
00:50:41.013 --> 00:50:49.750
Evan Ryan: we'll now move into the question and answer section of the of the webinar today.
00:50:51.180 --> 00:50:58.759
Evan Ryan: And we just have A. So if you have any questions, you can enter them in the Q&A box.
00:50:59.660 --> 00:51:06.380
Evan Ryan: And so a couple of questions here. So the 1st one are users able to create forecast insight questions.
00:51:06.885 --> 00:51:30.040
Evan Ryan: So at the moment we have a bank of questions that we've created working with a group of Sme treasure users. But you know, if you are using the system and if there is feedback there that you want to. You know, there's, I suppose, multiple ways that we can receive feedback from a product perspective.
00:51:30.606 --> 00:51:32.540
Evan Ryan: One is within that feedback.
00:51:33.089 --> 00:51:45.659
Evan Ryan: Functionality. And if there are users that are, you know, requesting questions quite regularly. Then certainly we can look at adding those questions to that bank, of questions.
00:51:51.680 --> 00:51:56.460
Mark Johnson: Yeah, maybe I'll I'll it's a good question. We saw another question. Similar
00:51:56.830 --> 00:52:25.349
Mark Johnson: framework on just hey? If I have my own questions or I want to see more suggestions to Evan's point, definitely wanting to build that bank even further. So as we get more users in it where where we can be pretty responsive and and building more out there. Another question we had was around estimated data deployment for G. Smart. So what Evan just demo today is available for any cash forecasting
00:52:25.380 --> 00:52:31.090
Mark Johnson: customer. And we can help you guys with getting that enabled. And we'll have
00:52:31.140 --> 00:52:40.429
Mark Johnson: kind of a next step slide right after this. But then we are currently producing what we showed with risk and the hub
00:52:40.490 --> 00:52:54.849
Mark Johnson: and working through what that delivery date looks like this year as well, but also an an early access program there. So if those were of interest, then definitely, please reach out and we will make sure you're a part of of both of those programs, too.
00:52:58.034 --> 00:53:22.509
Evan Ryan: I see another question here. What controls are in place to verify the accuracy of the AR reporting great question. And you know a question that we've spent a lot of time on from a testing perspective. And so you know, the the key focus for us from a accuracy perspective is ensuring that the the figures within the report are correct.
00:53:22.750 --> 00:53:50.200
Evan Ryan: Within those insights are correct. There is a number of ways to approach this, but ultimately what we've done within the AI Middleware is to set up a golden data set, and we can then use the AI as a judge using Llm. As a judge. Essentially, you're training. You're ensuring that the answers that come out essentially match
00:53:50.840 --> 00:54:07.389
Evan Ryan: the input and so within the prompting as well, there are a lot of guardrails that are implemented there. So you know, to really focus on the accuracy of the actual figures, and to reduce any hallucinations.
00:54:09.270 --> 00:54:29.009
Mark Johnson: Another question around additional costs. Are there additional costs to G. Smart, if you're already a cash analytics customer. So for those who already have cash forecasting. There's no additional cost for what we just demoed our priority with. That experience is driving adoption and learning, and frankly improving it as we go.
00:54:29.290 --> 00:54:35.180
Mark Johnson: and for now there's no plans to to charge extra for that particular experience.
00:54:43.210 --> 00:54:50.710
Evan Ryan: Yeah. So I see. Another question here will AI be integrated with the trend forecast functionality in the future.
00:54:50.880 --> 00:54:55.116
Evan Ryan: And so currently, the plan. As Mark mentioned,
00:54:55.850 --> 00:55:04.069
Evan Ryan: during his presentation. The plan is currently to implement AI within due treasury risk.
00:55:04.260 --> 00:55:31.290
Evan Ryan: So apply those same forecasting insights that you saw here, but from a risk perspective, and then the hub as well. But additionally, then, towards the you know, in the next couple of months we'll be looking for different areas within the actual tool within forecasting and obviously within the G Treasury platform, where we can uplift the current functionality so we can enable AI there as well.
00:55:34.220 --> 00:55:57.202
Mark Johnson: The controls is a great question. So what controls are in place to verify the accuracy of the AI reporting? So I I can start, and then Evan can definitely jump into. So there's a lot that's frankly where a lot of the work comes into play to make sure. Hey, what you guys see in the insights panel is exactly reflective of your data within G treasury.
00:55:57.540 --> 00:56:09.940
Mark Johnson: And we do that in a couple of different ways. Number one, we use multiple AI models in the process. So think of it as not only is is a model involved in the
00:56:10.370 --> 00:56:35.200
Mark Johnson: creation of that insights panel, but also another model involved in the review of that information. So we've got extra checks and balances there. We've also got kind of like that preliminary work when it comes to setting up the appropriate prompting, setting up the appropriate evaluation standpoint of all responses that are generated. And then another component is.
00:56:35.250 --> 00:56:42.529
Mark Johnson: we have real time visibility into the outputs and making sure. Hey, we have our own
00:56:43.140 --> 00:56:45.310
Mark Johnson: accuracy measurement in real time.
00:56:45.420 --> 00:56:59.920
Mark Johnson: and we can follow that, and also see, in addition to that. Evan mentioned that feedback panel with the thumbs up, thumbs down, and comments so we can directly see everything that gets submitted, and obviously respond accordingly to that.
00:57:00.180 --> 00:57:01.639
Mark Johnson: Evan. Any anything else.
00:57:01.640 --> 00:57:21.220
Evan Ryan: No no, you hit the nail on the head there, as I was kind of saying previously, you know, as you know, we use. The that Llm as a judge. So using that other AI model to basically judge and ensure that you know what does good look like and again, that's scored within the
00:57:21.850 --> 00:57:26.359
Evan Ryan: AI service, so that we ensure that those insights are accurate.
00:57:26.880 --> 00:57:33.980
Evan Ryan: And I see there's another question here about, how do we ensure that the insight
00:57:34.260 --> 00:57:47.010
Evan Ryan: insights ignore certain inputs from the report or from a reporting perspective? The key to that is actually, you know, really targeting what you input and introduce into the
00:57:47.130 --> 00:57:56.560
Evan Ryan: report from a parameters perspective. So you know, users can essentially configure the report in a multitude of different ways. So.
00:57:56.983 --> 00:58:18.620
Evan Ryan: You know, I had calls with one of our early access program users which were inquiring about, how do I exclude specific line items or business units, but you know that can easily be handled within the parameter section by just deselecting those items so that it doesn't actually get the report. In the 1st place.
00:58:25.120 --> 00:58:46.139
Mark Johnson: Looks like a couple of questions on how we think about applying G. Smart to liquidity management cash management, and that is definitely a part of the process. I think this goes back to how we landed on risk, and that as that next area, mostly driven by customer feedback.
00:58:46.290 --> 00:59:13.600
Mark Johnson: Well, we're applying the same approach for liquidity, planning, and other parts of the platform. So as you guys have ideas as you guys have used cases as you guys have interests and seeing kind of like what was shown today and how that could apply to other workflows directly within the platform. Well, we're definitely all ears for that. And you'll see on the next slide both my contact information and and Evan's contact information, too.
00:59:16.710 --> 00:59:17.470
Evan Ryan: And.
00:59:17.470 --> 00:59:18.140
Mark Johnson: With that. Maybe.
00:59:18.140 --> 00:59:18.580
Evan Ryan: Go ahead!
00:59:18.580 --> 00:59:21.189
Mark Johnson: More question, and then we'll we'll jump to the last.
00:59:21.190 --> 00:59:28.999
Evan Ryan: Yeah, yeah, I was just gonna say, I see there's kind of one question here. How do you forecast week one when
00:59:29.625 --> 00:59:44.620
Evan Ryan: AR and Ap are closing their ledger on their ERP. That might be something that maybe sits outside of this area, but specifically from a smart ledger perspective. That's where that AR and Ap data sits within
00:59:46.100 --> 01:00:01.820
Evan Ryan: solution. And then you can use mapping rules to map that AR and Ap data into that. You know 1st week of your forecast. And just yeah, as Mark said, conscious of time here. So I think it makes sense to move to the last slide.
01:00:02.960 --> 01:00:08.800
Mark Johnson: Yes. So look, really appreciate. You guys taking an hour with us today
01:00:08.960 --> 01:00:26.730
Mark Johnson: hope that the big goal of learning more about what's happening within the office of the CFO. How we're thinking about it as a company, both internally from a culture standpoint, but also with G. Smart as a part of our platform has been helpful
01:00:26.880 --> 01:00:46.830
Mark Johnson: and feel free to take a picture of the QR. Code where you can directly learn more about G. Smart. At the same time both my contact information and Evan's contact information is listed below, and if we did not get to your question we'll make sure to follow up individually as well.
01:00:47.080 --> 01:00:52.489
Mark Johnson: So again, thank you guys for the attendance. Thank you for the really great questions.
01:00:52.920 --> 01:00:55.970
Mark Johnson: and looking forward to partnering together on this journey.
01:00:57.160 --> 01:00:59.480
Evan Ryan: Thanks. Folks have a good rest of your day.
Bringing Clarity to Treasury AI: Introducing GSmart
AI is changing the game in finance, but most solutions aren’t built for the unique demands of treasury. Black-box models, generic platforms, and disconnected tools create more questions than answers.
That’s why GTreasury built GSmart, the only treasury-specific AI solution.
Watch a recording of our latest webinar, “Bringing Clarity to Treasury AI: Introducing GSmart,” to see how purpose-built AI can deliver real-time insights, intelligent automation, and explainable results.
Transcript
00:00:14.130 --> 00:00:24.260
GTreasury Marketing: Hello, everyone, and thank you for joining us today. We will be starting in a couple minutes to give all of our attendees time to join the webinar. So sit tight and we will be starting shortly.
00:01:27.300 --> 00:01:37.979
GTreasury Marketing: Okay, Hello, everyone. Thank you for joining us today for our webinar, bringing clarity to AI introducing G. Smart. Let's cover a couple of housekeeping items before we get started.
00:01:39.800 --> 00:01:59.430
GTreasury Marketing: Today's event is scheduled to last an hour, including time for questions at the end all participants are muted, and if you have any questions at any time throughout the presentation, please enter them into the Q&A section on your Zoom control bar. This webinar is being recorded, and a link to the recording will be sent via email to all participants.
00:02:01.710 --> 00:02:08.490
GTreasury Marketing: Our speakers today are Evan Ryan and Mark Johnson. Therefore I will hand it over to them for a quick introduction.
00:02:09.710 --> 00:02:31.199
Evan Ryan: Thanks very much. Great to be here with you folks today. My name is Evan Ryan. I'm a product manager here at Treasury, specifying in cash forecasting. I'll be jumping into the demo at the end of the presentation today, and really excited to show you what we've been working on over the last number of weeks
00:02:31.320 --> 00:02:32.459
Evan Ryan: over to you, Mark.
00:02:33.210 --> 00:02:55.960
Mark Johnson: Awesome. Thanks, Evan. So again, welcome everyone. I'm Mark Johnson, chief product officer at G. Treasury. I lead our global product management design and quant teams. I spent most of my career at this intersection of finance and technology from payments and resource management to financial automation and payroll
00:02:56.090 --> 00:03:06.140
Mark Johnson: really excited to to be with you guys today and talk about how we can help treasury teams like yourself escape some of the manual work that we know we all have to deal with.
00:03:06.820 --> 00:03:11.649
Mark Johnson: So with that, we're gonna jump in to a little bit of our journey.
00:03:12.020 --> 00:03:22.200
Mark Johnson: As we think about the the time we have today, we're gonna focus a lot on education, but also taking that education and turning it into action.
00:03:22.410 --> 00:03:36.660
Mark Johnson: you will see what's happening in the market when it comes to AI for finance. We'll share some statistics we'll talk about where companies are moving and why this transformation can't wait.
00:03:37.170 --> 00:03:57.870
Mark Johnson: We'll talk about G. Smart. G. Smart is our AI philosophy that we really think about amplifying you and your teams rather than augmenting or taking away something very tactical. It's a lot more than that when it comes to the strategy we hope to free up for for your teams.
00:03:58.350 --> 00:04:14.209
Mark Johnson: we're gonna jump into where we're going from a product innovation perspective, as we think about reimagining treasury workflows to Evan's point. We're gonna showcase this coming together in the form of a real live in production demo
00:04:14.340 --> 00:04:20.519
Mark Johnson: and then kind of give you behind the scenes. Look into what we have been focused on recently.
00:04:21.130 --> 00:04:22.230
Mark Johnson: Q. And a.
00:04:22.400 --> 00:04:35.679
Mark Johnson: as we mentioned at the top, very important to us. So please jump in and use the Q&A function at any point as questions pop up. If we can't get to all the questions today, we will follow up individually
00:04:36.508 --> 00:04:53.720
Mark Johnson: so please make sure to use that function. The last thing I'll I'll lead with is we want today to be designed with one goal which is helping you free up time to do what you do best, think strategically, build relationships, and ultimately move your business forward.
00:04:55.780 --> 00:05:16.360
Mark Johnson: The moment for finance in regards to AI is truly now, as we think about the immense change that is happening, not a gradual change, but truly a seismic shift, and the power of generative AI in particular, for a lot of different functions.
00:05:16.680 --> 00:05:28.719
Mark Johnson: These are some stats that we've been following. These stats are constantly coming up in new sources wanted to to start off with a few that that we've been close to
00:05:29.320 --> 00:05:37.590
Mark Johnson: the 1st 79% of CFOs plan to increase AI budgets in 2025.
00:05:38.010 --> 00:05:51.469
Mark Johnson: The most revealing, revealing part of this stat is the fact that this isn't necessarily the early adopters or the tech enthusiasts. These are pragmatic finance leaders
00:05:51.840 --> 00:05:53.319
Mark Johnson: who have run the numbers
00:05:53.610 --> 00:06:13.949
Mark Johnson: they're not investing because AI is trendy. They're not investing because everyone's talking about AI. They're investing because they are seeing the real benefit, and they are also in that conversation with their peers, hearing the opportunity, when it comes, to taking away toil from their teams day to day.
00:06:14.050 --> 00:06:25.829
Mark Johnson: When you see 7, 8 out of 10 CFOs moving in the same direction, you can't assume it's a trend anymore. This is kind of the new way of being the new way of working
00:06:26.580 --> 00:06:28.240
Mark Johnson: the next big step.
00:06:28.660 --> 00:06:35.940
Mark Johnson: 94% of CFOs expect generative AI to strongly benefit their function.
00:06:36.340 --> 00:06:42.820
Mark Johnson: In my years of technology it is very rare to see such an overwhelming statistic.
00:06:43.050 --> 00:06:52.759
Mark Johnson: especially an agreement on a strategic initiative. We've all been in those discussions, those boardrooms, those executive meetings. When you have that large of a consensus.
00:06:52.890 --> 00:06:55.509
Mark Johnson: you know the evidence is undeniable at that point.
00:06:56.180 --> 00:07:06.460
Mark Johnson: When we think about the results. Just take forecasting as a simple example, being able to drive up accuracy 30% or more. That's a game changer.
00:07:07.230 --> 00:07:08.849
Mark Johnson: The 3rd big Stat.
00:07:09.340 --> 00:07:23.529
Mark Johnson: 58% of finance functions have already adopted. AI in 2024. Now, that doesn't necessarily mean that's all generative. AI traditional AI has been around a little bit longer when we think about machine learning.
00:07:23.660 --> 00:07:31.459
Mark Johnson: But what you should think about is the fact that this is climbed up from the 37% just a year prior.
00:07:31.670 --> 00:07:38.710
Mark Johnson: That's a big shift, and that also speaks back to AI becoming richer and richer, and its capabilities.
00:07:39.480 --> 00:07:43.240
Mark Johnson: The other piece, the other key piece, is, look at the right hand of the side
00:07:43.590 --> 00:07:46.560
Mark Johnson: when we think about where
00:07:46.850 --> 00:07:59.060
Mark Johnson: it gets really interesting. CFOs want AI that they can rely on. They don't want black boxes. They want transparency. They want an explanation.
00:07:59.340 --> 00:08:04.539
Mark Johnson: we know trust is earned. This is where G. Treasury lives by this motto every day.
00:08:05.050 --> 00:08:16.380
Mark Johnson: This also aligns with some recent research by McKinsey publishing their own state of AI report. And the fascinating part of that report is the fact that
00:08:16.670 --> 00:08:31.339
Mark Johnson: we're now at a point where 21% of of companies reported using generative AI and a completely reimagined workflow, a completely reimagined way of how work gets done in some function.
00:08:31.810 --> 00:08:36.569
Mark Johnson: The the other piece that was really interesting as we're going through this study is the fact that
00:08:37.159 --> 00:08:54.219
Mark Johnson: when you think about AI transformation, it's fundamentally an organizational transformation, that organization is rethinking the way work gets done, but also the tools that are leveraged to to create that work and complete that job to be done.
00:08:55.110 --> 00:09:06.709
Mark Johnson: The CEO, in particular, is the one that is frequently involved in overseeing that AI governance, big change from anything we have ever seen before in the world of technology.
00:09:10.020 --> 00:09:10.970
Mark Johnson: So
00:09:11.140 --> 00:09:21.190
Mark Johnson: what we wanted to jump into before we get too deep is a quick poll question on where you guys are in your journey.
00:09:21.560 --> 00:09:24.110
Mark Johnson: So the question is.
00:09:24.280 --> 00:09:34.230
Mark Johnson: when do you expect to implement AI in Treasury operations? We'll give everyone a few seconds to respond to that, and then look at the results.
00:10:24.370 --> 00:10:36.590
Mark Johnson: Okay, so looks like we've got 35% looking to implement AI in 2026, we've got
00:10:36.770 --> 00:10:49.559
Mark Johnson: another 11% that are already using AI today, and then 16%. That plan to introduce AI into their operations before the end of the year. So again.
00:10:50.090 --> 00:10:59.850
Mark Johnson: pretty relevant and related back to the slide before around 50 to 60% have already adopted, or plan to adopt in the near future.
00:11:04.320 --> 00:11:17.789
Mark Johnson: Now, some of you may have seen our introduction of G. Smart and G. Smart for for us is both a milestone, and it's a starting point on on this journey that we're now a part of.
00:11:18.030 --> 00:11:28.179
Mark Johnson: We introduced G. Smart as kind of the future of AI powered treasury. At the same time, we're not changing our our mission statement as a company.
00:11:28.300 --> 00:11:35.819
Mark Johnson: For years she, treasury has been focused on the clarity to act and to try and to drive value
00:11:36.220 --> 00:11:37.909
Mark Johnson: for our customers.
00:11:38.200 --> 00:11:42.229
Mark Johnson: What's changed is the magnitude of what's possible.
00:11:42.790 --> 00:11:48.860
Mark Johnson: G. Smart represents a belief that the future office of the CFO.
00:11:49.050 --> 00:11:53.570
Mark Johnson: Won't be defined just by the tasks that get completed, but
00:11:54.070 --> 00:12:03.720
Mark Johnson: the insights that can get surfaced, the insights that will showcase a little bit later today, but also the decisions that you can start to accelerate
00:12:03.940 --> 00:12:10.999
Mark Johnson: and the strategies that you can then enable, based off of that that decision. Making process
00:12:11.160 --> 00:12:17.809
Mark Johnson: happens when your people are freed from some of that operational toil that they experience today.
00:12:21.680 --> 00:12:31.099
Mark Johnson: AI isn't new to to G. Treasury. As I mentioned earlier, traditional AI has been around a number of years, and
00:12:31.821 --> 00:12:39.810
Mark Johnson: this table showcases a few things that that I wanted to express number one transparency.
00:12:40.170 --> 00:12:50.610
Mark Johnson: as we think about different solutions within G treasury. We want to tell you exactly what function the AI is performing.
00:12:51.190 --> 00:12:56.259
Mark Johnson: what type of model we are using specific to AI,
00:12:56.380 --> 00:13:00.520
Mark Johnson: and then also what are the benefits it brings to you
00:13:00.780 --> 00:13:06.830
Mark Johnson: when we talk about cash forecasting as an example using agentic AI
00:13:07.260 --> 00:13:12.489
Mark Johnson: for decision making. We want you to know what that means. And and how does that work?
00:13:13.020 --> 00:13:15.160
Mark Johnson: The second big thing is
00:13:15.330 --> 00:13:24.290
Mark Johnson: our approach, and how diverse it is when it comes to not forcing one AI model on every problem.
00:13:24.770 --> 00:13:36.310
Mark Johnson: We know that statistical modeling is great for predictions. We know that fuzzy logic can be great for pattern matching.
00:13:36.870 --> 00:13:44.690
Mark Johnson: We also know that agentic AI is great for intelligent decision, support, and actions.
00:13:44.810 --> 00:14:03.000
Mark Johnson: So as we think about the solutions within G treasury. We're very diligent on the application of the AI model best suited to complete some type of job that that unravels, that that takes away that toil and completes that job on your behalf.
00:14:03.950 --> 00:14:08.810
Mark Johnson: The last thing that we're constantly focused on is
00:14:08.960 --> 00:14:22.719
Mark Johnson: the results we obviously are investing time to go and build this solution. And we want to make sure we are investing that time effectively. And as we think about the benefits that are possible.
00:14:22.780 --> 00:14:45.009
Mark Johnson: these aren't just theoretical anymore. Well, these are benefits. We're seeing firsthand when it comes to forecast accuracy, improving when it comes to risk scenarios being simulated in minutes and not hours. When it comes to integrations they used to take. Weeks can now be done in hours.
00:14:45.160 --> 00:14:49.190
Mark Johnson: All of this is real, tangible benefit that that drives value.
00:14:49.470 --> 00:14:57.270
Mark Johnson: This foundation also matters because it's the culmination of everything we've learned over time
00:14:57.540 --> 00:15:05.509
Mark Johnson: and how we've embedded intelligence within treasury workflows at the same time being very centered around.
00:15:05.610 --> 00:15:07.910
Mark Johnson: What does your team actually need?
00:15:11.620 --> 00:15:13.199
Mark Johnson: Probably the elephant in the room
00:15:13.610 --> 00:15:28.680
Mark Johnson: data. And obviously this is near and dear to our heart. It's near and dear to your heart. But protecting that data is, 1st and foremost, that the biggest principle we have, as we think about G. Smart.
00:15:29.100 --> 00:15:32.360
Mark Johnson: we started with Hey, earning your trust
00:15:32.510 --> 00:15:39.040
Mark Johnson: requires more than just promises. It requires a well sound architecture approach.
00:15:39.250 --> 00:15:47.569
Mark Johnson: It requires governance, it requires transparency, and what's taking place across the platform.
00:15:47.730 --> 00:15:51.980
Mark Johnson: And as we think about starting with the the data side.
00:15:52.090 --> 00:16:17.150
Mark Johnson: we want to make sure that, hey, you trust how we have created the solution. It all starts with your data. Living in your own environment. There's no co-processing. There's no sharing of data across tenants. There's no mysterious data lake where information could be co-mingled. Think of it as you have your own private AI that's been trained on
00:16:17.450 --> 00:16:21.390
Mark Johnson: the world's knowledge, but then can only see your data.
00:16:21.960 --> 00:16:32.249
Mark Johnson: The second big thing that has been a principle we followed is the fact that this is inference only. AI. What does that mean? It means that your data
00:16:32.410 --> 00:16:34.719
Mark Johnson: is never used to train models.
00:16:35.350 --> 00:16:41.420
Mark Johnson: We make sure the AI applies its intelligence to your data without learning from it.
00:16:42.510 --> 00:16:47.239
Mark Johnson: Another key piece is geographic control.
00:16:47.510 --> 00:16:52.089
Mark Johnson: We serve customers all over the globe. We want your data
00:16:52.260 --> 00:16:57.590
Mark Johnson: at rest to stay at rest within your selected geographic region.
00:16:57.760 --> 00:17:02.910
Mark Johnson: Whether that's in the Us. Whether that's in EMEA. Whether that's in APAC
00:17:03.110 --> 00:17:09.520
Mark Johnson: that goes back to how we set up just from the start, finally, control
00:17:10.351 --> 00:17:38.769
Mark Johnson: visibility into what is taking place in the platform is is key as well as the outputs that are being delivered. So being able to showcase the dotted trails around those outputs to showcase why a a particular step was taken. And then the user involvement around working with that particular let's call it agent. Experience like that could exist within the platform
00:17:39.800 --> 00:17:47.799
Mark Johnson: much more we go into here, but definitely wanted to focus on hey? Top of mind for us always as we're building
00:17:49.720 --> 00:18:00.650
Mark Johnson: the other piece that we wanted to walk through and kind of sneak peek behind the hood is our own internal transformation at G. Treasury.
00:18:01.350 --> 00:18:19.169
Mark Johnson: You've probably heard me mention transformation. You've heard me mention journey, and that's because it it really is. We're all keeping abreast with what's going on in the market. What are new sources we want to tap into to learn. How do we continue to set up our teams for success? And as we think about
00:18:19.420 --> 00:18:25.750
Mark Johnson: this particular slide, these aren't just principles, but they're how we operate day to day
00:18:25.960 --> 00:18:31.069
Mark Johnson: and to kind of give you some some real tangible examples here.
00:18:31.260 --> 00:18:46.710
Mark Johnson: Our product team, Evan, myself, the rest of the team. We're using AI across different parts of our day to day workflow when it comes to how we think about writing product requirements for something new that we plan to develop
00:18:47.000 --> 00:19:07.470
Mark Johnson: how we are able to prototype designs again in minutes which would have taken weeks before. That allows us to get real time feedback from those of you who are on the call from our clients, our our prospects, our partners, that feedback allows us to move a lot faster, and then
00:19:07.780 --> 00:19:12.390
Mark Johnson: we can frankly use that time back to spend more time.
00:19:12.570 --> 00:19:21.820
Mark Johnson: better understanding where you have new problems that are there popping up. It's that shift from doing manual work to more strategic work.
00:19:22.560 --> 00:19:30.000
Mark Johnson: The other piece that has been a big amplifier for us is this, this culture of experimentation.
00:19:30.210 --> 00:19:50.189
Mark Johnson: and where we see a lot of value and benefit is the ability to run workshops, the ability to run hackathons, to have a thesis in mind so that we're not chasing every shiny object. You will hear a lot of companies building AI just to build AI.
00:19:50.620 --> 00:19:59.339
Mark Johnson: We don't want to be that company. We want to make sure that we are scaling something that actually works and actually solves a problem
00:20:00.250 --> 00:20:03.229
Mark Johnson: outcome which leads us to outcome driven innovation.
00:20:03.840 --> 00:20:22.950
Mark Johnson: We've developed our own framework on how we think about prioritizing use cases. And to give you an example there for us, is it a high frequency task that's being done by a number of of companies? Is it a high, painful task? And then
00:20:23.070 --> 00:20:35.210
Mark Johnson: can AI actually amplify that that experience, that process? So someone spending a day a week on forecast analysis could hit all 3 check check boxes.
00:20:36.200 --> 00:20:47.570
Mark Johnson: the last and definitely most important. Hey, we want to bring our customers along as a part of any of this experience, and we want to start with conversations. We want to start with
00:20:47.710 --> 00:20:51.679
Mark Johnson: an early access program. That is, that isn't just beta testing.
00:20:51.790 --> 00:21:04.560
Mark Johnson: But it's frankly co-creating the experience together. When a customer tells us, Hey, I need a board level view of these insights. They're not just giving feedback. They're helping us co-design as we go.
00:21:04.840 --> 00:21:05.680
Mark Johnson: So
00:21:05.870 --> 00:21:13.729
Mark Johnson: take these principles, adapt them, modify them as as best fit for for you and your company. And then.
00:21:14.311 --> 00:21:22.619
Mark Johnson: understand, it isn't all technology. It's also about, hey? Starting with conviction, starting with your team and and your culture as a company.
00:21:25.930 --> 00:21:33.159
Mark Johnson: So now we're gonna switch gears a little bit and we're gonna showcase what we've been working on.
00:21:33.500 --> 00:21:51.989
Mark Johnson: some of which is live, some of which is in flight and definitely has an opportunity to get early access candidates, giving us feedback along the way. And some of it's in that design stage, but wanted to showcase a few examples to make it real for for you guys
00:21:53.070 --> 00:22:02.229
Mark Johnson: to to level set here, as we think about G. Smart, there's 2 key components to keep in mind
00:22:03.040 --> 00:22:04.100
Mark Johnson: one.
00:22:04.300 --> 00:22:13.169
Mark Johnson: It is how we're thinking about agents, agents that are designed to complete a specific Treasury task
00:22:13.320 --> 00:22:24.959
Mark Johnson: agents that can reason through problems. They can discover patterns, and they can recommend an action all while keeping the team in the loop
00:22:25.320 --> 00:22:27.039
Mark Johnson: throughout that process.
00:22:27.540 --> 00:22:29.810
Mark Johnson: The second piece is.
00:22:30.090 --> 00:22:50.090
Mark Johnson: think of it as your control tower, your hub where it's not just a dashboard of what's taking place, but a single area of the platform where you can govern, you can create, you can set your own unique thresholds to any one experience.
00:22:50.520 --> 00:23:00.329
Mark Johnson: We obviously know that not all clients are treated equally. Everyone has their own policies, their own processes. This is where the hub starts to come into play
00:23:00.680 --> 00:23:13.069
Mark Johnson: without the Hub. Agents are just isolated tools, and could be powerful, but could be very disconnected from your processes. So you don't want that. At the same time.
00:23:13.200 --> 00:23:14.759
Mark Johnson: if you think about
00:23:14.870 --> 00:23:32.569
Mark Johnson: only having a hub, you don't want just the dashboard and no ability to go orchestrate your own workflows. So the 2 elements come together as we think about our G. Smart AI vision, and then become a key compart of any treasury transformation.
00:23:35.710 --> 00:23:45.559
Mark Johnson: G. Smart forecast insights. I will purposely not steal too much of Evan's thunder here, as we will go deep in a demo. But
00:23:45.820 --> 00:23:59.860
Mark Johnson: did wanna showcase a little bit by telling a story on kind of how this started for us. So fictitious name. We'll use Sarah as a Treasury leader, who represents probably a lot of you on the call.
00:24:00.680 --> 00:24:04.110
Mark Johnson: Every, let's say Thursday of every week
00:24:04.270 --> 00:24:21.420
Mark Johnson: she goes through a routine. She's creating her own forecast comparison report. She probably has to export that to excel, to do her own analysis. She's typically going line by line to identify what's the largest variance?
00:24:21.770 --> 00:24:26.139
Mark Johnson: Where should I be concerned? What's unexplained versus explained.
00:24:26.310 --> 00:24:37.650
Mark Johnson: And then she's gotta put that all into some type of executive summary that executive summary could be for her executive team could be for a manager. It could be used in a board presentation.
00:24:38.340 --> 00:24:48.230
Mark Johnson: all that being said, that is a manual process that takes a number of hours every week for Sarah, and then the recipients of that information.
00:24:49.680 --> 00:24:56.319
Mark Johnson: When you think about G. Smart forecasting sites, our goal is, how do we reduce
00:24:56.480 --> 00:25:00.099
Mark Johnson: that Marathon into a 15 min sprint?
00:25:00.280 --> 00:25:03.620
Mark Johnson: And that's what Evan's gonna showcase in a little bit.
00:25:05.460 --> 00:25:16.530
Mark Johnson: The second item that we wanted to highlight is a similar approach to our risk management solution. But
00:25:16.970 --> 00:25:21.140
Mark Johnson: different use case when we think about risk
00:25:21.750 --> 00:25:34.460
Mark Johnson: risk. Policies in particular are those very lengthy, probably multiple format documents that have very good content, but trapped in a static way.
00:25:35.200 --> 00:25:40.940
Mark Johnson: you may have exposures that are tracked and excel spreadsheets.
00:25:41.200 --> 00:25:50.269
Mark Johnson: You may have your policy set up to identify when you have a breach, but maybe you don't find out about that breach until months later.
00:25:51.580 --> 00:25:55.650
Mark Johnson: Generally, you're you're falling way too late of a process. So
00:25:56.070 --> 00:25:59.330
Mark Johnson: as we think about applying AI here.
00:25:59.750 --> 00:26:02.950
Mark Johnson: G. Smart risks, insights can go back to
00:26:03.300 --> 00:26:24.769
Mark Johnson: saving you time and helping you in that decision making. We can look at using AI to read risk policies to monitor your exposures continuously to alert you before breaches occur, all that in real time within the platform. Not after this occurs, but before it occurs.
00:26:24.970 --> 00:26:32.279
Mark Johnson: And again, this is one of those areas that we're starting to work on now, and obviously would love feedback
00:26:32.540 --> 00:26:36.780
Mark Johnson: from from those on the call. As we as we go down this journey. Next.
00:26:37.240 --> 00:26:43.990
Mark Johnson: the 3rd piece that we wanted to showcase is called our G smart Hub.
00:26:44.750 --> 00:26:57.190
Mark Johnson: and, as I mentioned a little bit earlier again, think of this as kind of your control tower, your command center, that you can have visibility into what agents are available.
00:26:57.590 --> 00:27:12.189
Mark Johnson: you can start to determine which ones make sense for your business, and then you can take that next step of how do I want to configure it to my business? So, to give you a real life example. Think about
00:27:12.440 --> 00:27:15.760
Mark Johnson: the cash forecast submission process.
00:27:15.890 --> 00:27:23.340
Mark Johnson: You have multiple business units across the globe. Multiple people involved in submitting forecasts
00:27:23.490 --> 00:27:36.690
Mark Johnson: over a high frequency basis. What if you're the person who's chasing them all down? Well, that's that's not fun sending emails. They get phone calls trying to get everyone to go through the process. You've said.
00:27:37.320 --> 00:27:48.109
Mark Johnson: What if you could have an agent that that takes that action on your behalf? What if you could configure it to the point that says, Hey, look! Forecast submissions are going to be due
00:27:48.250 --> 00:27:51.100
Mark Johnson: every Friday at this point of every week.
00:27:51.320 --> 00:27:58.429
Mark Johnson: and I'm going to get a real time. Snapshot of who's submitted versus who hasn't submitted by middle of the week.
00:27:58.590 --> 00:28:00.250
Mark Johnson: and if you haven't submitted.
00:28:00.590 --> 00:28:14.970
Mark Johnson: have the agent chase you down and and remind you that we need the forecast submitted by the State, and then you can continuously get a snapshot of progression, of completed forecasts, thus driving
00:28:15.250 --> 00:28:42.540
Mark Johnson: a much more proactive behavior and giving you time back in your day to day. That's just one example of where you can start to control that experience to your own internal process. And then the second piece of it is okay. I can start to view other usage statistics across other agents. I can start to see the Roi firsthand
00:28:42.630 --> 00:28:49.879
Mark Johnson: of time savings that may be realized. Efficiency gains forecast accuracy, gains
00:28:50.210 --> 00:29:05.420
Mark Johnson: all of that in one place, and you can then follow what you want to do next. And maybe if I'm having success with this agent, I can go and think about this, this next use case and start to measure the Roi there
00:29:06.230 --> 00:29:17.139
Mark Johnson: again. This is this is where we're going, and and more to come on this one, and always for feedback as we as we co-design this with with an existing group of clients.
00:29:19.110 --> 00:29:28.719
Mark Johnson: So we're gonna switch gears again. And we're gonna open up another poll question. And as a part of this poll question
00:29:29.130 --> 00:29:32.960
Mark Johnson: I'll I'll have Evan. Then jump into the demo
00:29:33.931 --> 00:29:37.550
Mark Johnson: after the demo. We will leave some time for Q&A at the end.
00:29:45.230 --> 00:29:53.710
Mark Johnson: The question is, in which areas would your organization like to raise the bar for forecasting? And you can check multiple answers.
00:31:00.480 --> 00:31:04.439
Evan Ryan: I think we might give it one more, one or 2 more seconds on the
00:31:04.610 --> 00:31:09.270
Evan Ryan: those answers should be popping up perfect.
00:31:10.210 --> 00:31:13.250
Evan Ryan: Okay, so in which areas
00:31:14.316 --> 00:31:17.679
Evan Ryan: would your organization like to raise the bar for forecasting
00:31:18.739 --> 00:31:28.300
Evan Ryan: more advanced methods can see coming in at 24% better explanations required, and
00:31:28.500 --> 00:31:31.899
Evan Ryan: you can see less tolerance for errors at 11%.
00:31:33.120 --> 00:31:39.439
Evan Ryan: But just to call out the the better explanations required coming in at 27%. The highest
00:31:40.146 --> 00:31:42.280
Evan Ryan: are the more advanced methods
00:31:42.410 --> 00:31:58.379
Evan Ryan: at 24%. You know, that really does feed into the demo that I'll actually be jumping into now really focusing on the you know better explanations required so highlighting those key insights in a
00:31:59.210 --> 00:32:00.860
Evan Ryan: AI agentic manner
00:32:01.020 --> 00:32:16.189
Evan Ryan: and more advanced methods, there's some really cool data visualizations that I'm really excited to to show you today. So with that, I'll start sharing my screen here, Mark and I'll jump into the demo
00:32:22.690 --> 00:32:23.710
Evan Ryan: perfect.
00:32:24.746 --> 00:32:30.449
Evan Ryan: So here within GtTreasury, forecasting within our reporting suite.
00:32:31.327 --> 00:32:38.569
Evan Ryan: So, as Mark mentioned, you know, we're deploying AI across the G Treasury platform
00:32:39.353 --> 00:32:46.819
Evan Ryan: initially within G. Treasury forecasting and specifically within the G Treasury forecasting suite itself.
00:32:47.240 --> 00:32:52.459
Evan Ryan: So what we're looking at here is the landing page for the comparison report
00:32:53.190 --> 00:33:02.239
Evan Ryan: the comparison report compares 2 separate versions or snapshots of your forecast.
00:33:02.490 --> 00:33:10.630
Evan Ryan: In this instance I have my latest submission. So again, as Mark was talking about the G smart Hub.
00:33:11.334 --> 00:33:21.839
Evan Ryan: and that Treasury analyst preparing their submissions. Let's say that submission is prepared and finalized on that Thursday, and then that user then wants to compare
00:33:22.000 --> 00:33:31.179
Evan Ryan: the version that they've just prepared. Compare that, then, to their previous version, and then to dig into the variances in that report.
00:33:31.340 --> 00:33:33.910
Evan Ryan: So actually just run the report here.
00:33:35.800 --> 00:33:41.400
Evan Ryan: I have my report here with my forecast versus actuals and my forecast versus forecast.
00:33:41.680 --> 00:33:45.019
Evan Ryan: and I've grouped it by business unit.
00:33:45.490 --> 00:34:03.829
Evan Ryan: One thing I want to call out is that initial new feature that we have here? So you can see a spotlight panel that I can expand upon, and that's straight away, highlighting key variances that are surfaced within that report. So you know.
00:34:04.070 --> 00:34:12.650
Evan Ryan: we're talking about really reducing that toil and straight away you can see that this is really delivering value.
00:34:12.800 --> 00:34:16.739
Evan Ryan: So in this case there are 4 hidden cash flow differences that are uncovered.
00:34:17.179 --> 00:34:21.800
Evan Ryan: Firstly, we have a closing balance variance of a little over
00:34:22.110 --> 00:34:30.370
Evan Ryan: half 1 million dollars, calling out that balance between that forecast versus actuals piece than the largest negative variance.
00:34:30.510 --> 00:34:33.860
Evan Ryan: the largest positive variance, and then
00:34:34.020 --> 00:34:56.489
Evan Ryan: 2 new metrics that we're introducing as well. So smape and wmape really focusing on the accuracy of your forecast. So wmape is the weighted version really focusing on looking at the big ticket items and smape, looking at each line item in this case at an individual weighted level.
00:34:56.820 --> 00:35:16.689
Evan Ryan: and to interpret this. So the lower both of these figures are the better. But just to interpret what I'm looking at here, it looks like, because this W. Map is lower. I'm better at forecasting the bigger ticket items, and than I am at forecasting the smaller ticket items.
00:35:17.390 --> 00:35:38.680
Evan Ryan: I can click on this. I can see a bit more of an explainer here. And also we've embedded a helpful guide that goes into a bit more from a mathematical standpoint with the different formulas that we're using and how to actually interpret it, the pros and cons of the 2 different metrics.
00:35:38.920 --> 00:35:45.009
Evan Ryan: and, as I said, how to interpret your metrics, and then tips on how to improve your forecast
00:35:45.200 --> 00:35:46.439
Evan Ryan: going forward.
00:35:46.990 --> 00:35:50.350
Evan Ryan: So with that I'll generate the insights.
00:35:50.540 --> 00:35:53.590
Evan Ryan: And so, as I said, you know.
00:35:53.790 --> 00:35:59.869
Evan Ryan: straight away, I'm seeing great value from G smart, but I can, you know.
00:36:00.400 --> 00:36:05.645
Evan Ryan: do a deeper dive of my variance report here, and
00:36:06.910 --> 00:36:14.979
Evan Ryan: I can see from my tooltip here. So it's doing a number of things and evaluating the variance
00:36:15.560 --> 00:36:29.589
Evan Ryan: materiality thresholds. So it's preparing that forecast assessment, that executive summary that Mark was talking about a couple of moments ago, and then really will lead into the different sections of the report.
00:36:30.180 --> 00:36:33.060
Evan Ryan: And then, you know, based off of that
00:36:33.520 --> 00:36:47.470
Evan Ryan: question that was posed to you a couple of months ago. The on that poll question, a couple of cool visualizations that I I want to show you today.
00:36:48.410 --> 00:36:52.889
Evan Ryan: So and it's not just in the comparison report. This
00:36:53.060 --> 00:36:59.099
Evan Ryan: insights is actually also available in the Consolidation Report, which I'll show you in a couple of moments.
00:37:00.580 --> 00:37:09.970
Evan Ryan: So straight off the bat I can see what 2 submissions are being compared, and then the deep dive
00:37:10.556 --> 00:37:24.639
Evan Ryan: in the actual analysis. So I can look here at servicing the executive summary. So a high, level overview of the actual report that I sent to the AI model to be analyzed.
00:37:24.880 --> 00:37:32.540
Evan Ryan: I'm calling out the opening balance, the receipts, and then there are a number of key areas that I want to call out.
00:37:32.710 --> 00:37:41.239
Evan Ryan: firstly, the receipts, variance analysis. So those favorable variances and then unfavorable variances.
00:37:41.360 --> 00:37:47.629
Evan Ryan: and then the same side on the payments side as well. So those payment variance analysis.
00:37:49.230 --> 00:37:55.959
Evan Ryan: There's a table here for my top, 5 variants, so I can see my intercompany line item
00:37:56.170 --> 00:38:04.010
Evan Ryan: in the Ireland business unit had a variance of 6.7 million dollars. In this specific period
00:38:05.010 --> 00:38:23.699
Evan Ryan: a really exciting new feature or new part of this feature is the areas to investigate and act. And so, as Mark mentioned, you know, this really does save a lot of time. So you can see within a couple of moments. I've already generated an executive level summary report.
00:38:24.343 --> 00:38:34.089
Evan Ryan: I can easily copy this out, paste it into a an email. Send that to my manager to send that to the Cfo.
00:38:34.660 --> 00:38:40.080
Evan Ryan: But also highlighted here is that areas to investigate and act, and
00:38:40.350 --> 00:38:52.387
Evan Ryan: to really turn around that forecast accuracy and that you're seeing here. So in this case, 15.3% and really surfing, surfacing those insights.
00:38:53.110 --> 00:39:04.589
Evan Ryan: and no longer having to, you know. Dig through this report and go through that toil. It's already surfaced here so that you can quickly improve your forecast accuracy.
00:39:05.250 --> 00:39:13.779
Evan Ryan: I can also interact with the report here and give it a thumbs up and a thumbs down, and so that this report would be
00:39:14.220 --> 00:39:19.140
Evan Ryan: provided to you. You know, improved the next time you use it.
00:39:19.530 --> 00:39:29.789
Evan Ryan: So, as I said here, you know already I'm seeing great value from the spotlight panel. Those key variances are surfaced straightaway.
00:39:30.000 --> 00:39:37.640
Evan Ryan: and then once I click that generate insights button, I can see an executive summary level report is created here.
00:39:39.170 --> 00:39:43.730
Evan Ryan: but I can actually do a deeper dive on that
00:39:43.850 --> 00:39:48.389
Evan Ryan: on that data, on my report. So I can see a number of questions here.
00:39:48.640 --> 00:39:55.360
Evan Ryan: We've built up a bank of questions. I'm working with a an Sme group.
00:39:55.510 --> 00:40:07.040
Evan Ryan: and essentially the Llm. The AI. Is suggesting, based off of the content of this report. What questions best suit
00:40:07.380 --> 00:40:08.519
Evan Ryan: this report?
00:40:08.720 --> 00:40:11.780
Evan Ryan: So in this case. I'm going to ask.
00:40:11.970 --> 00:40:18.870
Evan Ryan: And AI, so what are my top? 5 closing balance variances by business unit?
00:40:19.250 --> 00:40:42.909
Evan Ryan: And essentially what this will do is generate a graph with a narrative attached to that graph here. So again, I've done this previously as well in previous roles, and I'm sure a lot of people on this call have done this where you're generating these graphs within excel, and you're picking different columns. But you can see how quickly
00:40:43.020 --> 00:40:45.020
Evan Ryan: this graph was generated.
00:40:45.580 --> 00:40:55.869
Evan Ryan: Again, I can copy this out individually, but what I would actually like to do is, I would like to add this to my report, and I can generate a final report
00:40:56.010 --> 00:40:57.000
Evan Ryan: at the end.
00:40:57.770 --> 00:41:04.420
Evan Ryan: So I'm going to ask a couple of more questions here. So how is my forecast accuracy trending?
00:41:04.930 --> 00:41:05.880
Evan Ryan: And
00:41:06.040 --> 00:41:18.169
Evan Ryan: so at a specific business unit level. And again, I'm going to get a graph that I can, you know, is quickly generated with a narrative. I could add that to my report.
00:41:18.330 --> 00:41:25.210
Evan Ryan: and in this case I'm wondering, you know, which business units at least accurate.
00:41:26.910 --> 00:41:47.139
Evan Ryan: So again, you know something that would take you know, time to download this report in excel imported, pull out my specific tables, build this in, excel, you know, quickly generate it, and I can add this to my report. So now that I have my executive summary report up top.
00:41:47.480 --> 00:41:52.179
Evan Ryan: and I've run my 3 different questions. But as if
00:41:52.680 --> 00:41:59.320
Evan Ryan: you'll note there, I've tagged each of them to be generated or to be included in a final report.
00:42:00.010 --> 00:42:09.809
Evan Ryan: So, rather than just generating a report where those 3 visualizations are kind of tagged on to the
00:42:10.280 --> 00:42:26.060
Evan Ryan: top summary, a cohesive narrative is actually created. So again, the AI is sent that 1st executive summary and those 3 reports, and is essentially prompted.
00:42:26.170 --> 00:42:27.840
Evan Ryan: and to be told.
00:42:28.000 --> 00:42:50.220
Evan Ryan: create a cohesive summary, a cohesive narrative based off of the executive summary and your 3 additional insights. And really, you know again. This is a fantastic time saver for users rather than having to go in, and, you know, adjust and update the narrative in the executive summary, and also
00:42:50.790 --> 00:43:04.839
Evan Ryan: the AI is prompted to disperse those visualizations as it best sees fit, and to, you know, ensure that there is a complete narrative. On the whole report.
00:43:05.429 --> 00:43:09.379
Evan Ryan: You know, and again, you know, users can export this to
00:43:10.240 --> 00:43:20.130
Evan Ryan: so that they can easily send this on in a board deck for for reporting, so I can see my executive summary is still here.
00:43:20.694 --> 00:43:21.935
Evan Ryan: You know. But
00:43:22.520 --> 00:43:32.100
Evan Ryan: I can see it's now, you know, focusing on it now knows that there is a business unit with the lowest frequency chart. So if I was to view the initial summary
00:43:32.240 --> 00:43:34.089
Evan Ryan: that wouldn't actually be there.
00:43:34.621 --> 00:43:46.259
Evan Ryan: Because, okay, so it's input this top 5 business unit by closing balance variance here again, not just tagging it on at the bottom, but creating that cohesive narrative.
00:43:47.282 --> 00:43:49.889
Evan Ryan: I can see my receipts, variance analysis.
00:43:50.716 --> 00:43:55.190
Evan Ryan: my payments, variance analysis. And then that forecast accuracy as well.
00:43:55.790 --> 00:44:05.690
Evan Ryan: So that's the forecast insights from the comparison report. I'm going to jump into the Consolidation report here.
00:44:05.850 --> 00:44:20.939
Evan Ryan: and I'll run my report. And again that consolidation report really is that Consolidated Bird's eye view of all of the different business units that I have in my system, in one cohesive view from a forecasting perspective.
00:44:21.340 --> 00:44:24.160
Evan Ryan: So again, I'm greeted with my spotlight panel.
00:44:24.860 --> 00:44:29.910
Evan Ryan: In this instance I can see there are 3 hidden cash flow differences uncovered.
00:44:30.060 --> 00:44:43.319
Evan Ryan: 1, st one is calling out the business units that are holding the most cash. So what business units are cash rich in this instance? So I can see the Uk. Canada and Netherlands.
00:44:44.390 --> 00:44:49.589
Evan Ryan: and very importantly as well what business units are experiencing.
00:44:50.228 --> 00:44:52.019
Evan Ryan: You know, short liquidity.
00:44:52.250 --> 00:45:00.899
Evan Ryan: Okay? So in this case there are 10 business units that are experiencing short liquidity. And the 3rd piece, then, is an overview of how my forecast
00:45:01.840 --> 00:45:08.990
Evan Ryan: is a going to basically trend over the next number of weeks. In this case, 13 weeks.
00:45:09.100 --> 00:45:17.300
Evan Ryan: I'm calling at the highest expected range over that week, those number of weeks so similar to the
00:45:17.966 --> 00:45:21.540
Evan Ryan: Comparison report. I'm going to generate my insights.
00:45:23.070 --> 00:45:45.850
Evan Ryan: you know, and as a user. You can really see the benefit of G. Smart here, straight off the bat again in the Consolidated report with that spotlight panel. Traditionally, users would have to download this in. Excel, start to go through it. Surface. Those, let's say, 3 business units that are cash, rich cash poor.
00:45:46.220 --> 00:45:58.550
Evan Ryan: whereas you know you can see straight away. I'm surfacing that information and but also again, like the Comparison report going into a deep dive analysis of the Consolidation report here.
00:45:59.160 --> 00:46:06.309
Evan Ryan: you know, obviously focusing on it from a liquidity perspective. Okay? So I have my executive summary
00:46:06.460 --> 00:46:22.960
Evan Ryan: and my current liquidity position. So in this case I can see I have 23.4 days of cash. So what's my starting balance? And what's my daily cash outflow? So in this instance, okay, I know I have 23.4 days of cash.
00:46:23.673 --> 00:46:37.219
Evan Ryan: Calling up my cash forecast. How that's looking over this 13 week period, and then the liquidity risk. So what business units are at risk from liquidity, perspective?
00:46:37.420 --> 00:46:44.740
Evan Ryan: What period does that call to, and the actual liquidity position for each of those business units.
00:46:45.630 --> 00:47:01.760
Evan Ryan: and similar to the comparison report highlighting those areas to investigate and act. So again, no longer having to dig through excel once you've exported this report. That's highlighted straight away so you can take, you know. Action.
00:47:02.292 --> 00:47:04.110
Evan Ryan: You know, straight off the bat
281
00:47:04.690 --> 00:47:25.460
Evan Ryan: again. I can copy this out. I can give it feedback, give it. A thumbs up, thumbs down, and you know, as I said, with the comparison report, consolidation report straight away. I'm getting great insights that I can easily send to senior management for reporting. But also I'm presented with a
00:47:25.580 --> 00:47:31.480
Evan Ryan: in this case 3 questions from a bank of questions that we've built up, that again, the
00:47:31.620 --> 00:47:38.869
Evan Ryan: AI is suggesting best fits the actual data in your graph or in your report here.
00:47:39.160 --> 00:47:44.389
Evan Ryan: So in this case, I want to know. Let's say, what business units
00:47:44.530 --> 00:47:48.120
Evan Ryan: are projected to run risk running out of cash.
00:47:49.340 --> 00:48:03.879
Evan Ryan: So again, similar to the comparison report, I'm going to be presented here with a table and and a narrative to go along with that table as well. So again say I want to add this to my report.
00:48:05.095 --> 00:48:09.319
Evan Ryan: Which, and let's say which business units have the highest cash position.
00:48:09.870 --> 00:48:12.897
Evan Ryan: And so here I I'm kind of
00:48:13.450 --> 00:48:17.840
Evan Ryan: told at a high level. In this case 10 business units and
00:48:19.800 --> 00:48:29.520
Evan Ryan: at expected to fall below the liquidity. And here we're calling it those top 5. Okay? So in this case I can see the United Kingdom.
00:48:31.110 --> 00:48:41.470
Evan Ryan: has the sorry in here. Yes, the the largest cash position. Here. We can see that the United Kingdom has the highest cash position, so I can add this to my report.
00:48:42.093 --> 00:48:46.976
Evan Ryan: And say, you know what business units are contributing most to
00:48:47.630 --> 00:48:58.589
Evan Ryan: Monster Cache Burn, so similar to the previous visualizations. I'm again presented with a table here and a narrative to go along with it.
00:48:58.760 --> 00:49:04.880
Evan Ryan: so I can add this to my final report, and I'm going to now request a final report.
00:49:05.370 --> 00:49:10.130
Evan Ryan: So, as I said with the comparison report here
00:49:10.580 --> 00:49:18.839
Evan Ryan: the Consolidation report, is sent to the AI, and then that executive summary is generated. I've asked.
00:49:19.180 --> 00:49:27.809
Evan Ryan: 3 insightful questions. And those insights are raised here and again those graphs
00:49:27.990 --> 00:49:53.869
Evan Ryan: and the narrative associated with them. They're not just appended to that executive summary up top. They're incorporated into the overall flow of the actual executive summary. So you know, again, saving time rather than having to go in and adjust the actual. You know executive summary. It intersperses those insights where it best fits, so that there's a cohesive narrative.
00:49:54.790 --> 00:50:01.450
Evan Ryan: So I can see here my business units with highest cash cash position and calls out, then the cash
00:50:01.780 --> 00:50:04.960
Evan Ryan: forecast. My average cash flows.
00:50:05.860 --> 00:50:19.169
Evan Ryan: my average cash outflows per business unit. And then my liquidity risk as well. And again, if I was to, kind of, you know, take a look through the narrative here again. It's going to tweak that nerve so that there is that
00:50:19.470 --> 00:50:26.960
Evan Ryan: cohesive narrative from a reporting perspective. Again, I can copy this out, put it into a board pack
00:50:27.340 --> 00:50:32.600
Evan Ryan: prepared for a deck that I can, you know, saves me a lot of time and and toil.
00:50:33.590 --> 00:50:38.799
Evan Ryan: So with that I'll stop sharing. I'll
00:50:41.013 --> 00:50:49.750
Evan Ryan: we'll now move into the question and answer section of the of the webinar today.
00:50:51.180 --> 00:50:58.759
Evan Ryan: And we just have A. So if you have any questions, you can enter them in the Q&A box.
00:50:59.660 --> 00:51:06.380
Evan Ryan: And so a couple of questions here. So the 1st one are users able to create forecast insight questions.
00:51:06.885 --> 00:51:30.040
Evan Ryan: So at the moment we have a bank of questions that we've created working with a group of Sme treasure users. But you know, if you are using the system and if there is feedback there that you want to. You know, there's, I suppose, multiple ways that we can receive feedback from a product perspective.
00:51:30.606 --> 00:51:32.540
Evan Ryan: One is within that feedback.
00:51:33.089 --> 00:51:45.659
Evan Ryan: Functionality. And if there are users that are, you know, requesting questions quite regularly. Then certainly we can look at adding those questions to that bank, of questions.
00:51:51.680 --> 00:51:56.460
Mark Johnson: Yeah, maybe I'll I'll it's a good question. We saw another question. Similar
00:51:56.830 --> 00:52:25.349
Mark Johnson: framework on just hey? If I have my own questions or I want to see more suggestions to Evan's point, definitely wanting to build that bank even further. So as we get more users in it where where we can be pretty responsive and and building more out there. Another question we had was around estimated data deployment for G. Smart. So what Evan just demo today is available for any cash forecasting
00:52:25.380 --> 00:52:31.090
Mark Johnson: customer. And we can help you guys with getting that enabled. And we'll have
00:52:31.140 --> 00:52:40.429
Mark Johnson: kind of a next step slide right after this. But then we are currently producing what we showed with risk and the hub
00:52:40.490 --> 00:52:54.849
Mark Johnson: and working through what that delivery date looks like this year as well, but also an an early access program there. So if those were of interest, then definitely, please reach out and we will make sure you're a part of of both of those programs, too.
00:52:58.034 --> 00:53:22.509
Evan Ryan: I see another question here. What controls are in place to verify the accuracy of the AR reporting great question. And you know a question that we've spent a lot of time on from a testing perspective. And so you know, the the key focus for us from a accuracy perspective is ensuring that the the figures within the report are correct.
00:53:22.750 --> 00:53:50.200
Evan Ryan: Within those insights are correct. There is a number of ways to approach this, but ultimately what we've done within the AI Middleware is to set up a golden data set, and we can then use the AI as a judge using Llm. As a judge. Essentially, you're training. You're ensuring that the answers that come out essentially match
00:53:50.840 --> 00:54:07.389
Evan Ryan: the input and so within the prompting as well, there are a lot of guardrails that are implemented there. So you know, to really focus on the accuracy of the actual figures, and to reduce any hallucinations.
00:54:09.270 --> 00:54:29.009
Mark Johnson: Another question around additional costs. Are there additional costs to G. Smart, if you're already a cash analytics customer. So for those who already have cash forecasting. There's no additional cost for what we just demoed our priority with. That experience is driving adoption and learning, and frankly improving it as we go.
00:54:29.290 --> 00:54:35.180
Mark Johnson: and for now there's no plans to to charge extra for that particular experience.
00:54:43.210 --> 00:54:50.710
Evan Ryan: Yeah. So I see. Another question here will AI be integrated with the trend forecast functionality in the future.
00:54:50.880 --> 00:54:55.116
Evan Ryan: And so currently, the plan. As Mark mentioned,
00:54:55.850 --> 00:55:04.069
Evan Ryan: during his presentation. The plan is currently to implement AI within due treasury risk.
00:55:04.260 --> 00:55:31.290
Evan Ryan: So apply those same forecasting insights that you saw here, but from a risk perspective, and then the hub as well. But additionally, then, towards the you know, in the next couple of months we'll be looking for different areas within the actual tool within forecasting and obviously within the G Treasury platform, where we can uplift the current functionality so we can enable AI there as well.
00:55:34.220 --> 00:55:57.202
Mark Johnson: The controls is a great question. So what controls are in place to verify the accuracy of the AI reporting? So I I can start, and then Evan can definitely jump into. So there's a lot that's frankly where a lot of the work comes into play to make sure. Hey, what you guys see in the insights panel is exactly reflective of your data within G treasury.
00:55:57.540 --> 00:56:09.940
Mark Johnson: And we do that in a couple of different ways. Number one, we use multiple AI models in the process. So think of it as not only is is a model involved in the
00:56:10.370 --> 00:56:35.200
Mark Johnson: creation of that insights panel, but also another model involved in the review of that information. So we've got extra checks and balances there. We've also got kind of like that preliminary work when it comes to setting up the appropriate prompting, setting up the appropriate evaluation standpoint of all responses that are generated. And then another component is.
00:56:35.250 --> 00:56:42.529
Mark Johnson: we have real time visibility into the outputs and making sure. Hey, we have our own
00:56:43.140 --> 00:56:45.310
Mark Johnson: accuracy measurement in real time.
00:56:45.420 --> 00:56:59.920
Mark Johnson: and we can follow that, and also see, in addition to that. Evan mentioned that feedback panel with the thumbs up, thumbs down, and comments so we can directly see everything that gets submitted, and obviously respond accordingly to that.
00:57:00.180 --> 00:57:01.639
Mark Johnson: Evan. Any anything else.
00:57:01.640 --> 00:57:21.220
Evan Ryan: No no, you hit the nail on the head there, as I was kind of saying previously, you know, as you know, we use. The that Llm as a judge. So using that other AI model to basically judge and ensure that you know what does good look like and again, that's scored within the
00:57:21.850 --> 00:57:26.359
Evan Ryan: AI service, so that we ensure that those insights are accurate.
00:57:26.880 --> 00:57:33.980
Evan Ryan: And I see there's another question here about, how do we ensure that the insight
00:57:34.260 --> 00:57:47.010
Evan Ryan: insights ignore certain inputs from the report or from a reporting perspective? The key to that is actually, you know, really targeting what you input and introduce into the
00:57:47.130 --> 00:57:56.560
Evan Ryan: report from a parameters perspective. So you know, users can essentially configure the report in a multitude of different ways. So.
00:57:56.983 --> 00:58:18.620
Evan Ryan: You know, I had calls with one of our early access program users which were inquiring about, how do I exclude specific line items or business units, but you know that can easily be handled within the parameter section by just deselecting those items so that it doesn't actually get the report. In the 1st place.
00:58:25.120 --> 00:58:46.139
Mark Johnson: Looks like a couple of questions on how we think about applying G. Smart to liquidity management cash management, and that is definitely a part of the process. I think this goes back to how we landed on risk, and that as that next area, mostly driven by customer feedback.
00:58:46.290 --> 00:59:13.600
Mark Johnson: Well, we're applying the same approach for liquidity, planning, and other parts of the platform. So as you guys have ideas as you guys have used cases as you guys have interests and seeing kind of like what was shown today and how that could apply to other workflows directly within the platform. Well, we're definitely all ears for that. And you'll see on the next slide both my contact information and and Evan's contact information, too.
00:59:16.710 --> 00:59:17.470
Evan Ryan: And.
00:59:17.470 --> 00:59:18.140
Mark Johnson: With that. Maybe.
00:59:18.140 --> 00:59:18.580
Evan Ryan: Go ahead!
00:59:18.580 --> 00:59:21.189
Mark Johnson: More question, and then we'll we'll jump to the last.
00:59:21.190 --> 00:59:28.999
Evan Ryan: Yeah, yeah, I was just gonna say, I see there's kind of one question here. How do you forecast week one when
00:59:29.625 --> 00:59:44.620
Evan Ryan: AR and Ap are closing their ledger on their ERP. That might be something that maybe sits outside of this area, but specifically from a smart ledger perspective. That's where that AR and Ap data sits within
00:59:46.100 --> 01:00:01.820
Evan Ryan: solution. And then you can use mapping rules to map that AR and Ap data into that. You know 1st week of your forecast. And just yeah, as Mark said, conscious of time here. So I think it makes sense to move to the last slide.
01:00:02.960 --> 01:00:08.800
Mark Johnson: Yes. So look, really appreciate. You guys taking an hour with us today
01:00:08.960 --> 01:00:26.730
Mark Johnson: hope that the big goal of learning more about what's happening within the office of the CFO. How we're thinking about it as a company, both internally from a culture standpoint, but also with G. Smart as a part of our platform has been helpful
01:00:26.880 --> 01:00:46.830
Mark Johnson: and feel free to take a picture of the QR. Code where you can directly learn more about G. Smart. At the same time both my contact information and Evan's contact information is listed below, and if we did not get to your question we'll make sure to follow up individually as well.
01:00:47.080 --> 01:00:52.489
Mark Johnson: So again, thank you guys for the attendance. Thank you for the really great questions.
01:00:52.920 --> 01:00:55.970
Mark Johnson: and looking forward to partnering together on this journey.
01:00:57.160 --> 01:00:59.480
Evan Ryan: Thanks. Folks have a good rest of your day.
Ausgewählte Ressourcen


.png)
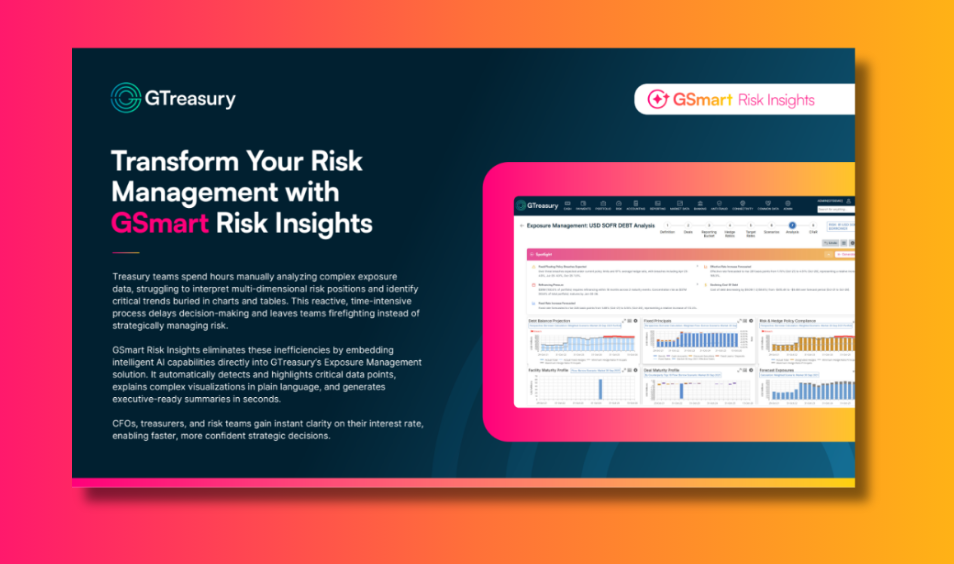
.png)


.png)


%404x.png)


Siehe GTreasury in Aktion
Nehmen Sie noch heute Kontakt mit unterstützenden Experten, umfassenden Lösungen und ungenutzten Möglichkeiten auf.